| gold demand by source by year tonnes |
--------------- |
--------------- |
--------------- |
|---|---|---|---|
| jewelry | |||
| bullion bars | |||
| ETF | |||
| technology | |||
| countries | |||
| total |
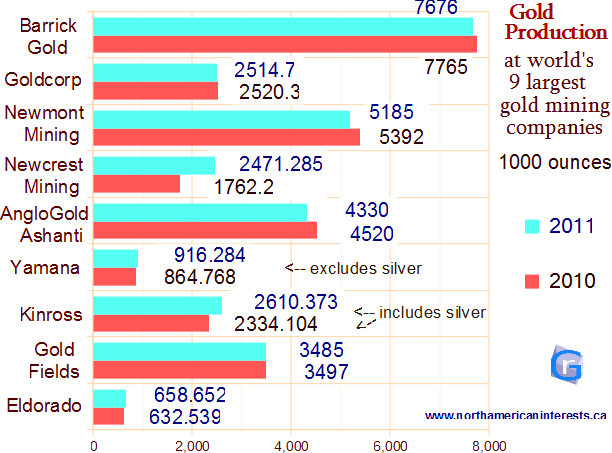
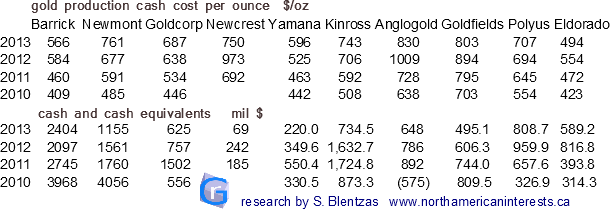
Production shown is for Calendar Year (CY). Newcrest Mining Fiscal Year ends in June.
2012 information: production stats available at article Gold Supply and Demand.
In 2012 Barrick Gold profited $3.426 billion during the first three quarters however a $4.0 billion writedown related to certain copper assets incurred in the final quarter meant the company lost money on the year. The company's cash equivalents fell significantly in 2011 ($3.968b to $2.745b) due to the acquisition of Equinox Minerals.
Newmont Mining's dividend of $1.40 in 2012 is nearly triple 2011 ($0.50). Cash equivalents $1.561b is down from $4.056b in 2010.
Goldcorp remains the lowest cash cost producer on an all in cash cost basis ($874 includes every expense including energy, maintenance, exploration costs).
2013 Kinross Gold reserves down significantly: 42.781 million ounces versus 59.599m the year before. silver reserves 68.225m-> 44.761m.
2012 Kinross Gold reserves down by 3.0 million ounces to 59.6m, silver reserves down 16.6m oz to 68.2m. 2013 reserves down to 54.4 million.
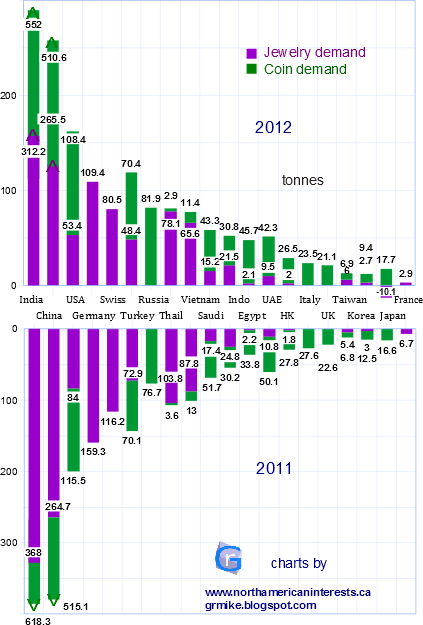
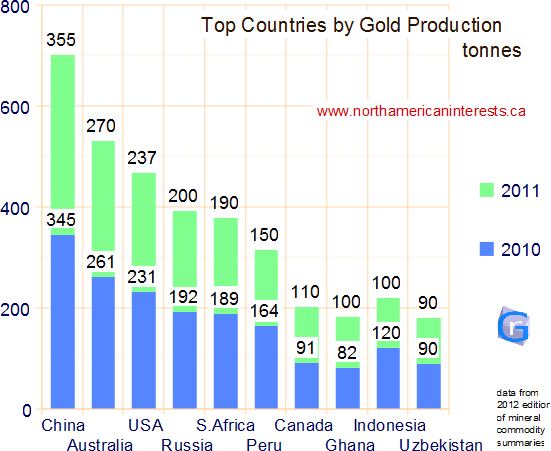
Top 6 gold consuming nations didn't change ranks between 2010 and 2011. Newcomer Thailand vaulted ahead of Vietnam and Saudi Arabia on higher gold coin and bar demand (over 95% of demand came from there, and investment demand was +66%). South Africa has the highest production costs in the world that's why it's rank has dropped from 1 in 2007 to 5 today; South Africa is still home to 12% of the world's gold reserves (6000 out of world total 51000 tons) behind only Australia which has 7400 tons.
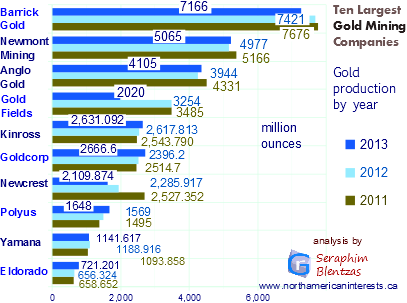
Most gold producers reported stable gold production however one notable exception was Freeport McMoran (not listed because gold only accounts for 12% of its revenue so not really a pureplay); Freeport gold output was down for the 2nd straight year, -27% annual decline same as last year (1.383M oz down from 1.886M oz in 2010, 2.664M oz in 2009).
Newmont's gold production in 2011 was about the same as it was in 2008 (5.2 million ounces). Newmont was 1 of 3 major gold producers that absorbed project writedowns in the final quarter of 2011 ($1.64 billion for Newmont at Canadian mine, $640 million for Agnico-Eagle Mines, $2.4B for Kinross Gold).
About one sixth of Newmont Mining's production comes from its 20.3 million ounce reserves, Boddington Mine in Australia (over 750th oz in 2011, 728,000 oz in 2010). It is Australia's largest mine after Kalgourlie Super Pit. Boddington's proven reserves are 3.76M oz 20% lower than they were in 2009.
AngloGold Ashanti more than doubled its 4Q2011 dividend (26 cents) even though earnings were 28% lower quarter to quarter. 2011 production of 4.33M oz was 650,000 oz lower than 2008.