| gold demand by source by year tonnes |
--------------- |
--------------- |
--------------- |
--------------- |
|---|---|---|---|---|
| jewelry | ||||
| bullion bars | ||||
| ETF | ||||
| technology | ||||
| countries | ||||
| total |
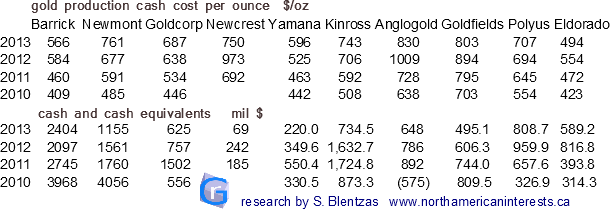
gold mining production costs by company
2012 gold demand - country specific charts now available at: Gold In 2013
Consumers spent $236.4 billion on gold in 2012, $5 billion more than in 2011, 48% more than 2010 when demand in terms of tonnage was only 6.0% lower. To put things into perspective, total money spent on gold in 2003 was 7.8 times less than in 2012.
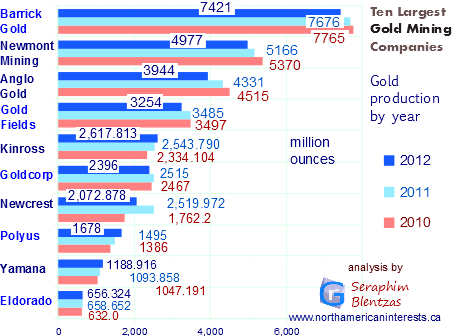
Since 2007 China has been the world's number one gold producing nation (that year, China increased its output by 1.27 million ounces at a time when other major producing regions recorded negative growth). In 2012 China produced 370 tonnes of the yellow metal (up 15t) 2.2 times more than South Africa, accounting for 13.7% of global mine output. China gold output estimated to reach 440t in 2013 +63% vs 2007; despite this, China remains a net importer (imports 100 tonnes a month 1h2013). Combined, gold consumption by China, India accounts for 75% of global primary production.
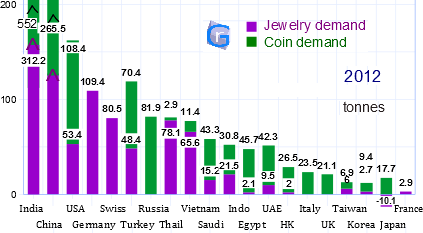
A lot of the jewelry demand in the developing world comes from India which is the number one source of demand for the yellow metal. In preparation for festivals like diwali consumers buy a lot of gold jewelry, that has led to India being home to 37% of the jewelry market which is 746 tons in size. In 2010 India consumed about 30% more gold than it did in 2009; In 2011 Indian demand was (gross, including coins and bars) was 933.4T -3.1% on the year. For a short period of time in 2011 (1st qtr), China was the number one consumer of gold (25% of global demand). Prior to that, in the 1st quarter of 2010 Indian demand was 6.2% higher than Chinese demand (90.9t vs 85.6t).