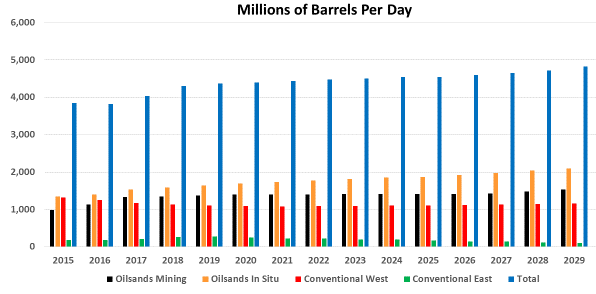
- 2026 Production Outlook: projections suggest total output will exceed 5.7 million barrels per day (MMb/d) "optimization" of existing projects.
- Key Drivers: Major producers like Canadian Natural Resources (CNRL) and Suncor are increasing output through efficiency improvements rather than major new projects, with CNRL aiming for 1.59–1.65 million barrels of oil equivalent per day (boepd) and Suncor targeting 840,000–870,000 bpd in 2026.
- Production Limitations: S&P Global expects Canadian production growth to plateau after 2026 as available pipeline capacity becomes full.
- Capacity vs. Production: While total potential capacity from various proposals is high, actual forecasted output for 2026 reflects a more moderated increase.
.png)
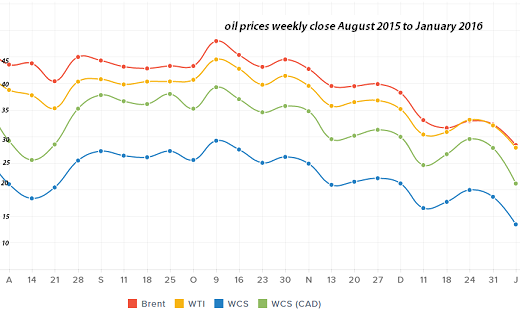
a timeline of events impacting oil production in canada
june 20, 2024: wti is up to nearly $82 usd recovering quickly from a fall in the previous week stemming from news that output from opec may increase slightly due to certain cuts not being renewed.
December 11, 2023 : wti which this week has fallen to its lowest level in 6 months ($69) is on the move up again. it was driven down by data out of the eia showing that us domestic oil production reached a record high of 13 million barrels per day in september/october. opec softened the blow with its own cuts of 1 million bpd by saudi arabia and another 1 million by other members yet to be determined. it is moving up due to a resumption of hostility in gaza, missile fires at oil tankers off the coast of yemen, and goldman sachs reporting that the federal reserve will begin lowering rates in march 2024. the oil market is in disarray - while canadian natural resources continues to edge closer to a new 52 week high, suncor and cenovus flounder just 10% away from 52 week lows. this could be a buying opportunity !
Norway's wealth fund excludes Cdn oilsands investments over emissions
Western Canada Select (WCS), the price obtained for many Alberta producers of oil, averaged US$36.82 a barrel in January 2020, 7.3% higher than it was a year earlier. It costs approximately $10/bbl for a barrel of crude to be transported from Alberta to the U.S. Gulf Coast, accounting for at least $10/bbl of the WTI-WCS discount. Pipeline constraints can also cause the transportation differential to rise significantly The differential of WTI over WCS was US$20.86 in January 2020. When oil price reached record low $22 in march 2020 the differential was $15 ($7 wcs).
trudeau policies wrecking havoc in Alberta
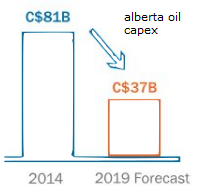
The government of Alberta mandated production curtailment from January 1 to December 31 2019, indicating that a lack of sufficient pipeline and rail takeaway capacity, as well as storage facilities being at near capacity, was costing the Canadian economy more than C$80M per day. The negative impact such lack of capacity has had on investment in Canada's oil and gas sector is undeniable. The Canadian Association of Petroleum Producers (CAPP) has forecasted that capital investment across Canada's oil and natural gas sector will have fallen by 54% in the last five years.
WTI WCS spread UP --- August 2018 : $31 2017 average : $13
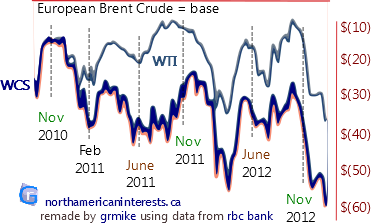
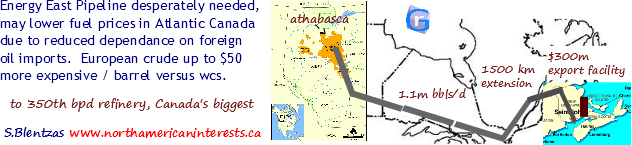
Canada’s export pipeline blockade — first Northern Gateway, then Energy East and now Trans Mountain — are the direct cause of the current, record-breaking fifty-dollar discount on Canadian oil shipped to the U.S. Until a new export pipeline to a coastal port is built and operating, neither American nor Canadian companies will have much interest in investing in new Canadian production. This is a result of govenrment policies and won't change until the government does.
Encana - $7.7-billion deal for Newfield’s oil assets is its most recent U.S. acquisition. Encana had already made significant new investments in the U.S. in the Permian and Eagle Ford fields over the past three years.
During February 2018 oil prices stuck at $50 keeps oil production in Alberta at just under 3.0 million barrels a day - with 3.7m expected by 2030 (vs 5.0 million bpd previous forecast made just 3 ya.
high start up costs are proving to be a major stumbling block for producers because $50 oil isn't feasible.
no refineries = no investment Foreign companies are taking money out of the oil sands to the tune of $23 billion (2017) and moving it stateside where shale is proving to be a more lucrative investment option. for instance, the Permian Basin Texas gives better returns more quickly thanks to its proximity to the refineries. 2017 annual growth rate of 21% vs 10% at oil sands.
Canadian regulations more hostile, less competitive
- new methane emissions regulations, the 100-megatonne hard cap on oilsands emissions and the phasing out of coal-fired electricity and its replacement by more expensive wind and other renewables. This makes it more expensive to do business in Canada, especially for “energy intensive, trade-exposed” companies (EITE).
- Not surprisingly, Canadian oil and gas is the highest EITE sector in Canada. It takes a lot of energy to produce oil and gas and therefore more CO2 emissions. About 78 per cent of what we produce is exported, and 99 per cent of these exports are sold to the U.S. at prices set by international markets. This means that carbon taxes and other climate-change-related costs cannot be passed on to American purchasers. They are taken out of Canadian producers’ bottom lines. This explains the growing exodus of Canadian capital and energy companies to the U.S.
Back in 2016, the price gap between WCS and WTI oil tumbled in percentage terms at only half the price ($20 vs $40). In 2014 the price gap (Canadian Select vs WTI Texas oil) increased in percentage terms after having narrowed in late 2012 to under $12; it held steady at $17-$25 in the first half of 2013. Over the entire 2011 year, the gap narrowed by 11%. Also to consider is European Crude (brent crude) which exceeds WTI by $20 to $30. A widening spread means that Canadian oil is harder to market, either because of transportation issues (train and pipeline capacity) or other effects: refinery utilization rates / Whiteing Indiana refinery shut downs. update - on January 14, 2015 the price gap stood at $13.90 (30% difference) which is relatively high when you consider that oil prices halved over the past year Jan 2014 $92.72 vs Jan 2015 $46.96. wti price of $46 in January 4Q 2014 was $73.14.
This trend in oil prices continued well into 2017 and 2018, albeit at a slower pace.
2017 update - Select Canadian oil companies increasing capex capital spending. Cenovus Energy capex up 24% to $1.4 billion oil sands output to 184th bpd +20%, total output 240th bpd +14%. Tourmaline Oil $1.35 billion Shell Canada acquisitions. Arc Resources $660M. 7 Generations Energy $1.60B.
Oil Pipelines now approved ! 2 of 3 pipeline projects approved in late November by Canada's liberal federal government. Largest of the 3 was rejected Northern Gateway line (Edmonton -> bc export port). Trans Mountain expansion (Edmonton -> BC southern port increased flow 330th -> 900th bpd) and another pipeline from Edmonton to Wisconsin (390th -> 750th bpd) are now approved.
Oil activity down in 2016 - vs 2014; capex down 62% to $50 billion; largest two year drop in history. Oil wells drilled also down 10,400 -> 3,500. Canadian Assoc Of Petroleum Producers
Positive influences: 1. Enbridge reversing the direction of oil flow through its Seaway Pipeline (Oklahoma--> Gulf Coast 1.4 mbpd) which made it easier for buyers to access Canadian oil/reduced supply glut (as a result, WTI price revised upwards to $118 at JP Morgan). 2. Better heavy crude oil conversion in PADD II (Petroleum Administration for Defence Districts II in North-Central USA, the location of refineries which process over half of Canada's oil). 3. a wider gap provides powerful incentive for companies and governments to build the infrastructure needed to transport the oil to regions that earn a higher return. In Canada, spending by oil companies accounts for 3% of gdp. Negative influences: lack of refineries in western Canada, lack of pipelines from Western to Eastern Canada, New England.
Alberta oil production becoming more energy efficient: In 2013 Cenovus Energy's Christina Lake project required 1.8 barrels of steam to produce 1 barrel of oil, that's down from 1.9 barrels in 2012. One way Canadian companies are lowering energy requirements is by mixing the steam with butane, more oil output per barrel of steam: lower steam to oil ratio.
Facts: 44% of crude oil processed at Canadian refineries comes from international sources, something that's bound to change given that much of the foreign oil is purchased at higher prices than oilsands oil and that oilsands producers are in need of Eastern Canada's oil refining capacity. 2013 - Imperial Oil closes its 70th boe/d Dartmouth refinery.
2014-2035: Canadian oil output to increase 75% to 5.8m bpd, according to NEB report. This Over the same timeframe Canadian demand up +28%, 20% lower due to efficiencies in per unit economic output. Jobs in Canada tied to oil sands to increase 75,000 -> 900,000 over 25 years - remember oil production also growing in Saskatchewan and East Coast.
Teck Resources - holds 20% share in Alberta's next mega oil project Fort Hills. The $13.5 billion project won't begin producing oil until 2017. The project is a joint venture between Suncor 40.8% (2P 1.2b barrels), Total 39.2%, Teck 20%. Teck is in a nice position too - has $2b cash with only $300m in debt due over next 3 years (as of Jan 2014), $2b credit facility.
Oct 21: Canadian oil companies absent from Brazil's massive offshore Libra oil field - oil field containing 12 billion barrels will be developed by Petrobras and a consortium of foreign companies including Shell, Total, CNOOC, China National Petroleum Corporation. Nov 2013: Carl Icahn ups stake in Talisman Energy to 6.96%.
State-owned CNOOC China credits Nexen acquisition with 8% boost in 1h2013 earnings ($5.8b). 12.5% of first half oil output came from Nexen (24.8/198.1 million barrels). In the long-run, Calgary benefits from the deal - cnooc makes Calgary head office of North, South American operations. cnooc to list on Toronto Stock Exchange. In September 2013 China imported more oil than the US for the first time ever: China: 6.3mbpd (production 10.9mbpd vs consumption 4.6mbpd). USA: 6.1mbpd (prod 18.6mbpd vs cons 12.5mbpd).
production data below updated every third quarter. reserves 2014 graphical , top 12 list
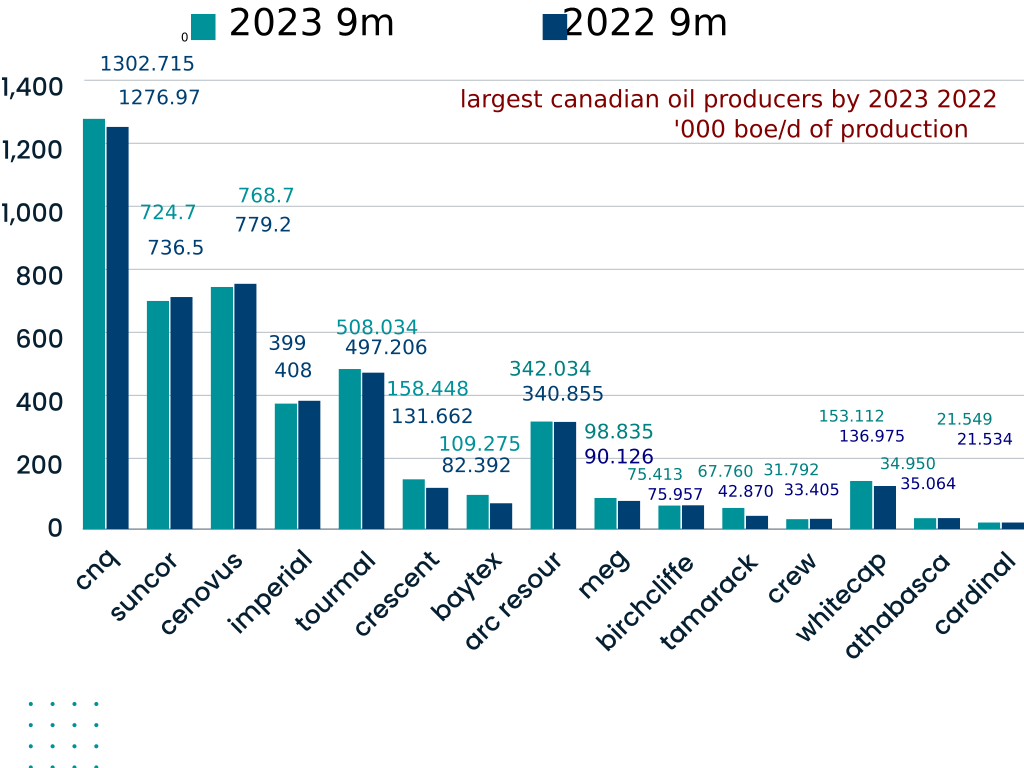
2023 oil production by company <----
 April 2021 - Seven Generations shareholders approve $8.1-billion merger with Arc Resources -> Canada's sixth largest oil producer 340,000 boe/d.
January 21, 2014 - Canadian Association of Petroleum Producers says oil companies will cut $23 billion in spending ($69-> $46b) due to low market prices - will result in a loss of 120,000 bpd output 2016. Investments in oil sands expected to be $25b (vs $33b in 2015).
According to Meg Energy the Blend vs WTI % differential was 31.2% 2012 vs 23.5% in 2011. 3q refinery crack spread : $35 -> $16.
3q2014 penn west petroleum heavy oil average selling price plumments 14% $84->$72; light oil down only 5%. positives: long term debt down -27%.
Canada oil reserves @175 billion barrels -2013 US Energy Admin. DYK? 12% of US oil exports now condensate fuel. exports of this ultra light type of fuel oil used to be banned.
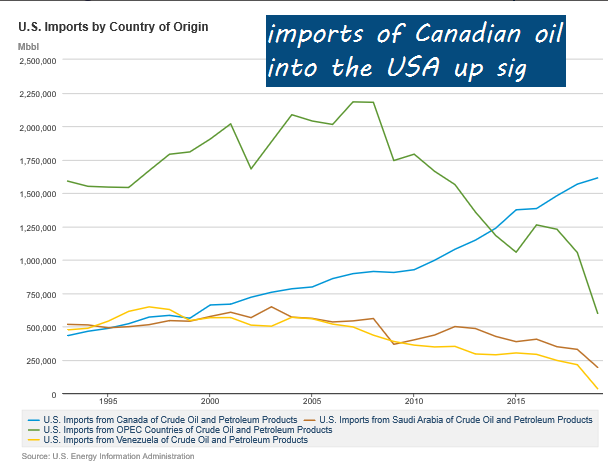
Risks to Canadian production: Leadership changes in Venezuela (211b boe reserves) and Mexico (11 to 22b boe) could potentially make them stable, efficient suppliers. This is because so far, politics have kept foreign investment out, making it difficult for companies to upgrade to the technology needed to develop their oil which like Canada's, is unconventional. 2006-2012 US imports: Mexico (-30%), Venezuela (-41% to 1.0m boe/d). November 8: asphalt company NuStar Energy ends oil contract with Venezuela (PDVSA) - 30,000 bpd lost represents 4% of US-Venezuela oil imports - replaced with Alberta naphthenic crude imported to East Coast by rail. Venezuela exports the USA plummeted in 2019 to just 30 thousand barrels from over 200th the previous years.
recommended oil stocks: CanElson Drilling Inc - operates land-based contract drilling rigs throughout North America. CVE:CDI - highest utilization rates in the industry. Canadian Oil Sands Ltd (cos) owns 36.74% of the Syncrude oilsands project - share of proved reserves total 1.8b barrels out of 4.8b total. Trouble with machinery (boiler/coker) cut 2013 annual production estimate from 105-115 to 97-100 million barrels. pembina pipeline : sole transporter of crude for CNRL and Syncrude.
August 14, 2014 - Encana makes fourth mega deal in a year ($6.8b total), becoming once again an oil and gas focused petroleum producer. One of only a handful of Canadian companies with major assets south of the border - latest acquired asset is located within the Eagle Ford Shale area of South Texas (light oil). Latest deal is worth $1.2 billion and gives Encana a big stake in Eagle Ford's 1.5 million bpd oil boom ; that 's a 50% increase in output in just one year !
3q 2013: Talisman and PennWest lower output. PennWest production down 17% to 133,712 bpd. total debt down $1 billion to $3.0b, capital expenditure down (3q $405m -> $55m, 9m $1053m ->$556m). North Sea asset sale to Chinese company cost Talisman 67th bpd net of royalties in 9m2013.
Quebec- Wind power not economically feasible. each job created costs $200th per year in subsidies but pays only $40th. this loss is passed onto consumers (-> 4.3% inflation in power rates)
March 2017 - ConocoPhillips sells its joint venture with Cenovus in Alberta for C$17 billion ; it took 208 million shares of Cenovus, as well as C$14.1 billion of cash.
Cenovus Energy, one of the largest in terms of total resource (140 billion boe) was jointly partnered with ConocoPhillips at a number of projects (ended march 2017 with a buyout); those projects were expected to double production (2013 to 2017) with some of the boost coming from Narrows Lake. liquids capacity 2014 -> 2023: 435th -> 525th bpd. January 2014 proved reserves up +5% to 2.3b boe (bitumen accounts for 80%). from 3q2012 -> 4q2013 Christina Lake alone increased output from 42th -> 61,471 boe/d (up 47%). Royalties lowest at Christina Lake ($2.72/bbl in 2013, $2.32 4q) vs $3.34 Pelican / $5.72 oil sands. Imperial Oil is also heavily invested in the oil sands ($11b Kearl project). CVE Quick Analysis: Integrated oil company so crack spread affects earnings. 3% dividend yield, average valuation but high quality assets. TransCanada $12b Energy East Pipeline
Husky Energy has presence in China : 3q2014 gas sales from the Liwan gas project in South China Sea 200-220 mmcfpd vs 180-200 in 2q2014. also Liuhua 29-1 field first production in 2018.
data in the following tables comes from 2013, 2012, 2011 annual reports, 40-f filings, 10-k presentations, management discussion and analysis documents
- Enbridge to triple capacity of one of its US pipelines running through Wisconsin by adding more piping stations: from 400,000 bpd to 1.2 million bpd. This will significantly impact North Dakota's oil industry since 60% of its oil output is currently being moved by rail. Enbridge has also proposed another pipeline: Sandpiper (225,000 bpd to Minnesota + 375,000 bpd to NW Wisconsin).
- Major refineries in the US upgraded to handle more heavy Canadian crude (including ones run by British Petroleum)
- Big glut of supply in Wisconsin may be relieved when portions of the Keystone pipeline come online.
- Southern leg of Keystone Pipeline that runs to Cushing, Oklahoma began operating January 22, 2014
- Trans Mountain pipeline from Edmonton to Burnaby, recently tripled its capacity from 300th to 890th.
State-owned CNOOC China credits Nexen acquisition with 8% boost in 1h2013 earnings ($5.8b). 12.5% of first half oil output came from Nexen (24.8/198.1 million barrels). In the long-run, Calgary benefits from the deal - cnooc makes Calgary head office of North, South American operations. cnooc to list on Toronto Stock Exchange. In September 2013 China imported more oil than the US for the first time ever: China: 6.3mbpd (production 10.9mbpd vs consumption 4.6mbpd). USA: 6.1mbpd (prod 18.6mbpd vs cons 12.5mbpd).
Meg Energy - During the month of January 2014, Meg transported 20% of its entire production by rail (6 trains 60,000 barrels each). This enabled it to transport the oil to North American refining regions where heavy oil commands a higher price.. as opposed to areas where there's a glut of supply .. oil gets sold at a discounted price. Meg 2014 results- 2P reserves 2497B half probable up 9.6%; production on track to reach 260th bpd by 2020. 2013 avg output 35,317 +6,644, 42,251 bpd in 4Q13 +9,959 net operating costs per barrel $10.01 +$0.03; royalties $3.14 +0.68; results were worst in the 4Q (transportation costs double @0.51/bbl, royalties lower @2.71 but oil price realized -$11 vs full year ($38.22 vs $49.28). revenue was highest in Q3 ($401.8m +88%).
December 2013 - US oil inventories -5.59m barrels vs -0.5m est. May 2014 -3.431m vs -0.271m est, +1.657m in April.
March 2016 - TransCanada Pipeline buys Colombia Pipeline (Houston) for $13 billion (gas pipeline assets up 40%).
2014 - Talisman Energy buyout by Repsol SA for $8.3 billion. 65% of Canada top 30 oil and gas producers are foreign controlled versus 52% in 2006 but Canadian companies have been reversing this trend in recent years.
2015 - Canadian companies buy $248 billion foreign companies versus only $20 billion by foreign companies of Canadian institutions.
| 2023 9M | 2022 9m | ||||||||||||||||||||||||||||||||||||||||||||||||||||||
| liquids | N.gas | total | liquids | N.Gas | total | ||||||||||||||||||||||||||||||||||||||||||||||||||
| oil boe | mmcf | mmcf | |||||||||||||||||||||||||||||||||||||||||||||||||||||
| CNRL | 948.587 | 2125 | 1302.715 | 930.079 | 2081 | 1276.970 | |||||||||||||||||||||||||||||||||||||||||||||||||
| Suncor | 724.7 | 0 | 724.7 | 736.5 | 0 | 736.5 | |||||||||||||||||||||||||||||||||||||||||||||||||
| cenovus | 632.5 | 867,400 | 768.7 | 634.1 | 868,700 | 779.2 | |||||||||||||||||||||||||||||||||||||||||||||||||
| imperial oil | 394 | 32 | 399 | 391 | 101 | 408 | |||||||||||||||||||||||||||||||||||||||||||||||||
| tourmaline | 113.993 | 2364,246 | 508.034 | 111.430 | 2314,655 | 497.206 | |||||||||||||||||||||||||||||||||||||||||||||||||
| crescent | 122.613 | 215.012 | 158.448 | 108.782 | 137,277 | 131.662 | |||||||||||||||||||||||||||||||||||||||||||||||||
| baytex | 93.414 | 96,787 | 109.275 | 68.686 | 82,232 | 82.392 | |||||||||||||||||||||||||||||||||||||||||||||||||
| arc | 130.414 | 1302 | 342.034 | 133.868 | 1242 | 140.855 | |||||||||||||||||||||||||||||||||||||||||||||||||
| meg energy | 98.835 | 0 | 98.835 | 90.126 | 0 | 90.126 | |||||||||||||||||||||||||||||||||||||||||||||||||
| birchcliffe | 12.989 | 374,544 | 75.413 | 14.095 | 371,174 | 75.957 | |||||||||||||||||||||||||||||||||||||||||||||||||
| whitecap | 101.357 | 310,531 | 153.112 | 99.462 | 225,076 | 136.975 | |||||||||||||||||||||||||||||||||||||||||||||||||
| tamarack | 55.821 | 71,633 | 67.760 | 31.730 | 66,839 | 42,879 | |||||||||||||||||||||||||||||||||||||||||||||||||
| crew energy | 6.317 | 1416,47 | 31.719 | 7.731 | 1540,41 | 33.405 | |||||||||||||||||||||||||||||||||||||||||||||||||
| athabasca | 2.781 | 13,181 | 34.950 | 3.714 | 16,635 | 35.064 | |||||||||||||||||||||||||||||||||||||||||||||||||
| cardinal | 18.898 | 15.903 | 21.549 | 19.061 | 14,836 | 21.534 | |||||||||||||||||||||||||||||||||||||||||||||||||
| 2014 9 Months | |||||||||||||||||||||||||||||||||||||||||||||||||||||||||||||||
|---|---|---|---|---|---|---|---|---|---|---|---|---|---|---|---|---|---|---|---|---|---|---|---|---|---|---|---|---|---|---|---|---|---|---|---|---|---|---|---|---|---|---|---|---|---|---|---|---|---|---|---|---|---|---|---|---|---|---|---|---|---|---|---|
| Light | NGL | Heavy | liquids | N.Gas | total | ||||||||||||||||||||||||||||||||||||||||||||||||||||||||||
| oil boe | boe | oil boe | boe | mmcf | boe | ||||||||||||||||||||||||||||||||||||||||||||||||||||||||||
| CNRL | 437.380 | 227.834 | 1367 | 665.214 | |||||||||||||||||||||||||||||||||||||||||||||||||||||||||||
| Suncor | 524.4 | 3.0 | 18 | 527.4 | |||||||||||||||||||||||||||||||||||||||||||||||||||||||||||
| Encana Corp | 42.9 | 37.3 | na | 80.2 | 419 | 2515 | 2996mcf | ||||||||||||||||||||||||||||||||||||||||||||||||||||||||
| Talisman Energy | 140.701 | 230.299 | 1379 | 371 | |||||||||||||||||||||||||||||||||||||||||||||||||||||||||||
| Husky Energy | 235 | 99.0 | 594 | 334 | |||||||||||||||||||||||||||||||||||||||||||||||||||||||||||
| Imperial Oil | 18 | incl | 241 | 259 | 28.5 | 171 | 287.5 | ||||||||||||||||||||||||||||||||||||||||||||||||||||||||
| Cenovus (gross) | na | 1.200 | 34.488 | 40.060 | 81.833 | 491 | 281.033 | ||||||||||||||||||||||||||||||||||||||||||||||||||||||||
| Penn West Petrol | 55.301 | incl | 13.251 | 68.552 | 37.744 | 226 | 106.296 | ||||||||||||||||||||||||||||||||||||||||||||||||||||||||
| Crescent Point | incl | incl | incl | 124.310 | 12.106 | 72.633 | 136.416 | ||||||||||||||||||||||||||||||||||||||||||||||||||||||||
| ARC Resources | 3.741 | 4.331 | 36.213 | 110.501 | 66.213 | 397.3 | 110.501 |
| 2013 9 Months | 2012 9 Months | ||||||||||||||||||||||||||||||||||||||||||||||||||||||||||
|---|---|---|---|---|---|---|---|---|---|---|---|---|---|---|---|---|---|---|---|---|---|---|---|---|---|---|---|---|---|---|---|---|---|---|---|---|---|---|---|---|---|---|---|---|---|---|---|---|---|---|---|---|---|---|---|---|---|---|---|
| Oil | NGas | total | Oil | NGas | total | ||||||||||||||||||||||||||||||||||||||||||||||||||||||
| boe | mmcf | boe | mmcf | ||||||||||||||||||||||||||||||||||||||||||||||||||||||||
| CNRL | 410.533 | 182.450 | 1095 | 592.983 | 380.291 | 206.046 | 1237 | 586.337 | |||||||||||||||||||||||||||||||||||||||||||||||||||
| Suncor | 522.3 | 41.8 | 251 | 564.1 | 496.8 | 49.7 | 298 | 546.5 | |||||||||||||||||||||||||||||||||||||||||||||||||||
| Encana Corp | 49.8 | 464.7 | 2788 | 3087mcf | 29.3 | 498.9 | 2993 | 528.2 | |||||||||||||||||||||||||||||||||||||||||||||||||||
| Talisman Energy | 95 | 190 | 1143 | 285 | 137 | 221 | 1315 | 358 | |||||||||||||||||||||||||||||||||||||||||||||||||||
| Husky Energy | 227.2 | 86.0 | 515.8 | 313.2 | 201.5 | 94.1 | 564.4 | 295.6 | |||||||||||||||||||||||||||||||||||||||||||||||||||
| Imperial Oil | 216 | 31 | 188 | 247 | 205 | 33 | 197 | 238 | |||||||||||||||||||||||||||||||||||||||||||||||||||
| Cenovus (gross) | 176.085 | 89.167 | 535.0 | 265.252 | 161.291 | 100.333 | 602 | 261.624 | |||||||||||||||||||||||||||||||||||||||||||||||||||
| Nexen Inc | 158.5 | 31.7 | 190 | 190.2 | |||||||||||||||||||||||||||||||||||||||||||||||||||||||
| Penn West Petrol | 87.268 | 51.565 | 309 | 138.833 | 105.848 | 57.787 | 347 | 163.635 | |||||||||||||||||||||||||||||||||||||||||||||||||||
| Crescent Point | 106.823 | 10.987 | 65.919 | 117.810 | 87.009 | 8.635 | 51.8 | 95.644 | |||||||||||||||||||||||||||||||||||||||||||||||||||
| ARC Resources | 36.787 | 57.684 | 346.1 | 94.471 | 35.967 | 56.847 | 341.1 | 92.814 |
| 2011 9 Months | 2010 9 Months | ||||||||||||||||||||||||||||||||||||||||||||||||||||||||||
|---|---|---|---|---|---|---|---|---|---|---|---|---|---|---|---|---|---|---|---|---|---|---|---|---|---|---|---|---|---|---|---|---|---|---|---|---|---|---|---|---|---|---|---|---|---|---|---|---|---|---|---|---|---|---|---|---|---|---|---|
| Oil | NGas | total | Oil | NGas | total | ||||||||||||||||||||||||||||||||||||||||||||||||||||||
| boe | mmcf | boe | mmcf | ||||||||||||||||||||||||||||||||||||||||||||||||||||||||
| CNRL | 313.786 | 200.053 | 1200 | 513.839 | 368.852 | 196.461 | 1178 | 565.313 | |||||||||||||||||||||||||||||||||||||||||||||||||||
| Suncor | 475.1 | 60.8 | 365 | 535.9 | 518.3 | 93.5 | 561 | 611.8 | |||||||||||||||||||||||||||||||||||||||||||||||||||
| Encana Corp | 24.0 | 548.5 | 3291 | 572.5 | 24.0 | 528.2 | 3169 | 551.8 | |||||||||||||||||||||||||||||||||||||||||||||||||||
| Talisman Energy | 145.0 | 203.0 | 786 | 348.0 | 158.0 | 195.0 | 721 | 353 | |||||||||||||||||||||||||||||||||||||||||||||||||||
| Husky Energy | 208.6 | 101.7 | 610.1 | 310.3 | 204.2 | 85.2 | 511.0 | 289.4 | |||||||||||||||||||||||||||||||||||||||||||||||||||
| Imperial Oil | 205.0 | 38.0 | 229 | 243.0 | |||||||||||||||||||||||||||||||||||||||||||||||||||||||
| Cenovus (gross) | 130.857 | 109.000 | 654 | 239.857 | 129.052 | 118.7 | 712 | 247.75 | |||||||||||||||||||||||||||||||||||||||||||||||||||
| Nexen Inc | 145.2 | 38.3 | 230 | 183.5 | |||||||||||||||||||||||||||||||||||||||||||||||||||||||
| Penn West Petrol | 101.569 | 59.602 | 358 | 161.171 | 96.832 | 404 | 67.291 | 164.123 | |||||||||||||||||||||||||||||||||||||||||||||||||||
| Crescent Point | 64.224 | 7.078 | 42.5 | 71.302 | 52.519 | 38.134 | 229 | 58.875 | |||||||||||||||||||||||||||||||||||||||||||||||||||
| ARC Resources | 31.267 | 49.250 | 295.5 | 80.517 | 31.186 | 39.151 | 234.9 | 70.337 |
click image to expand
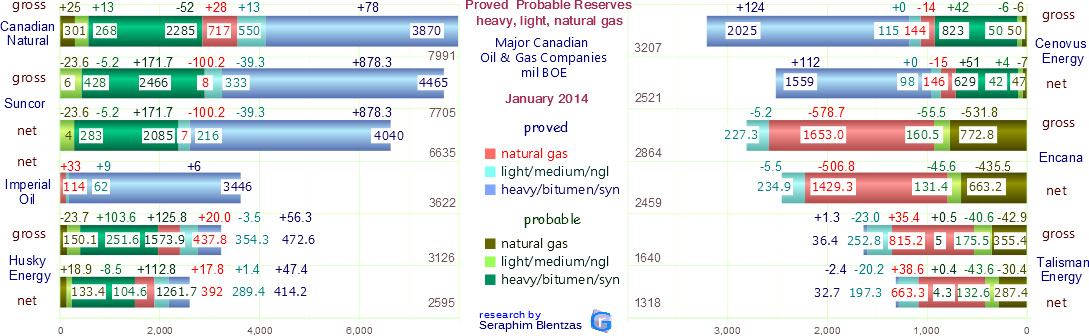
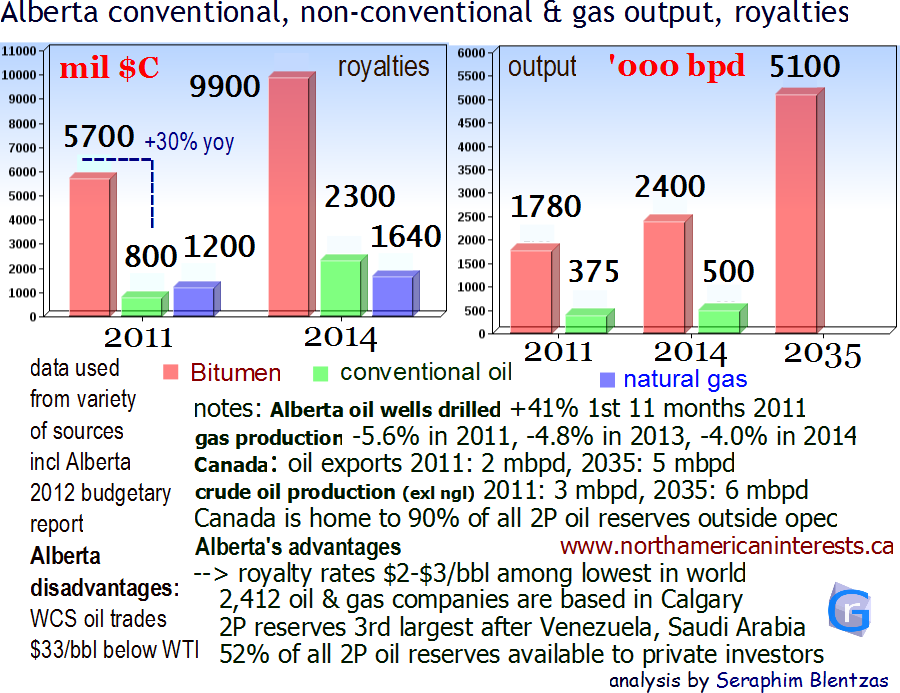
Best estimate contingent resource 2014: Canadian Oil Sands Ltd: 5100 million (-100) 1900 net (no change) 30+ years Meg Energy: 3700 million (+300)
| Jan 2014 | ||||||||||||||||||||||||||||||||||||||||
|---|---|---|---|---|---|---|---|---|---|---|---|---|---|---|---|---|---|---|---|---|---|---|---|---|---|---|---|---|---|---|---|---|---|---|---|---|---|---|---|---|
| Gross | Net | |||||||||||||||||||||||||||||||||||||||
| Oil | NGas | Total | Oil | NGas | Total | |||||||||||||||||||||||||||||||||||
| Mboe | Bcf | Mboe | Mboe | Bcf | Mboe | |||||||||||||||||||||||||||||||||||
| CNRL | 6973 (4420) | 6109 (4305) | 7991 (5137) | |||||||||||||||||||||||||||||||||||||
| Suncor | 7692 (4798) | 83 (48) | 7705 (4806) | 6622 (4256) | 76 (40) | 6635 (4263) | ||||||||||||||||||||||||||||||||||
| Imperial Oil | 3508 | 678 | 3622 | |||||||||||||||||||||||||||||||||||||
| Husky Energy | 2565.4 (851.2) | 3501.1(2602.5) | 3126.7(1264.7) | 2094.8 (726.4) | 3128 (2330.1) | 2595.3(1095.6) | ||||||||||||||||||||||||||||||||||
| Cenovus | 3013 (2140) | 1165 (865) | 3207 (2284) | 2328 (1657) | 1160 (877) | 2521 (1803) | ||||||||||||||||||||||||||||||||||
| Encana Corp | 437.8 (277.3) | 14555 (9918) | 2864 (1930.3) | 366.3 (234.9) | 12555 (8576) | 2459 (1664) | ||||||||||||||||||||||||||||||||||
| MEG Energy | 2897 (1446) | 2897 (1446) | ||||||||||||||||||||||||||||||||||||||
| Can.Oil.Sands | 4500 | na | 4500 | 1700 | na | 1700 | ||||||||||||||||||||||||||||||||||
| Talisman | 469.7 (289.2) | 7024 (4891.4) | 1640 (1104) | 366.9 (230.0) | 5704.2(3978.8) | 1318 (893) | ||||||||||||||||||||||||||||||||||
| Penn West | 438 (290) | 1123 (757) | 625 (415) | 371 (247) | 980 (664) | 534 (358) | ||||||||||||||||||||||||||||||||||
| Crescent Point | 608.784 (396.992) | 329.848 (214.647) | 663.758 (432.767) | 533.600 (351.514) | 297.934 (194.845) | 586.256 (383.989) |
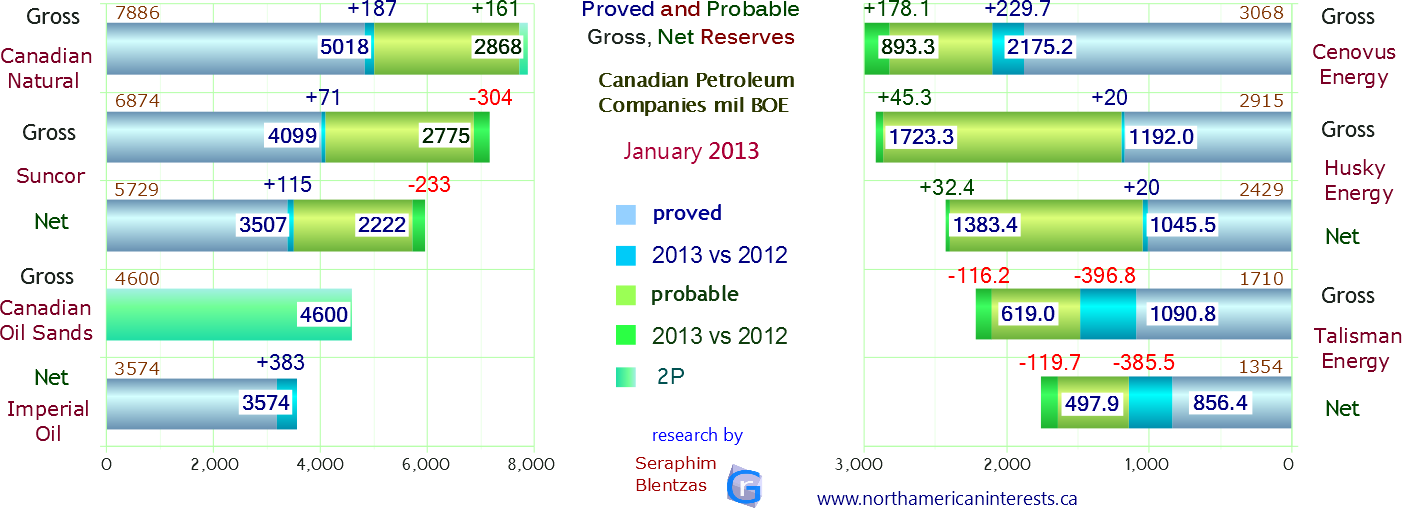
| Jan 2013 | ||||||||||||||||||||||||||||||||||||||||
|---|---|---|---|---|---|---|---|---|---|---|---|---|---|---|---|---|---|---|---|---|---|---|---|---|---|---|---|---|---|---|---|---|---|---|---|---|---|---|---|---|
| Gross | Net | |||||||||||||||||||||||||||||||||||||||
| Oil | NGas | Total | Oil | NGas | Total | |||||||||||||||||||||||||||||||||||
| Mboe | Bcf | Mboe | Mboe | Bcf | Mboe | |||||||||||||||||||||||||||||||||||
| CNRL | 6921 (4329) | 5790 (4134) | 7886 (5018) | |||||||||||||||||||||||||||||||||||||
| Suncor | 6686 (3957) | 1128 (852) | 6874 (4099) | 5569 (3383) | 960 (744) | 5729 (3507) | ||||||||||||||||||||||||||||||||||
| Imperial Oil | 3493 | 488 | 3574 | |||||||||||||||||||||||||||||||||||||
| Husky Energy | 2370.2 (774.1) | 3265.2 (2506.8) | 2915.3 (1192) | 1940.2 (671.3) | 2932.4 (2245.3) | 2428.9 (1045.5) | ||||||||||||||||||||||||||||||||||
| Cenovus | 2853 (2016) | 1293 (955.2) | 3068.5 (2175) | 2169 (1545) | 1291 (967) | 2384.2 (1706.2) | ||||||||||||||||||||||||||||||||||
| Encana Corp | 498.5 (282.5) | 21218 (13390) | 4034.8 (2514) | 417.4 (240.4) | 18209 (11617) | 3452.2 (2176.6) | ||||||||||||||||||||||||||||||||||
| MEG Energy | 6064c | 6064c | 2644 (1284) | 2644 (1284) | ||||||||||||||||||||||||||||||||||||
| Can.Oil.Sands | 4600 | 4600 | 1700 | 1700 | ||||||||||||||||||||||||||||||||||||
| Nexen | 2048 (860) | 1065 (444) | 2226 (934) | 1758 (772) | 1002 (420) | 1925 (842) | ||||||||||||||||||||||||||||||||||
| Talisman | 531.5 (310.9) | 7069.1 (4678.9) | 1709.7 (1090.7) | 429.3 (249.2) | 5654.7 (3748) | 1371.8 (873.9) | ||||||||||||||||||||||||||||||||||
| Penn West | 441 (289) | 1186 (773) | 676 (445) | 379 (251) | 1029 (680) | 578 (384) | ||||||||||||||||||||||||||||||||||
| Crescent Point | 557.068 (366.5) | 310.373 (203.053) | 608.797 (400.373) | 468.256 (309.080) | 281.453 (184.576) | 539.497 (356.186) |
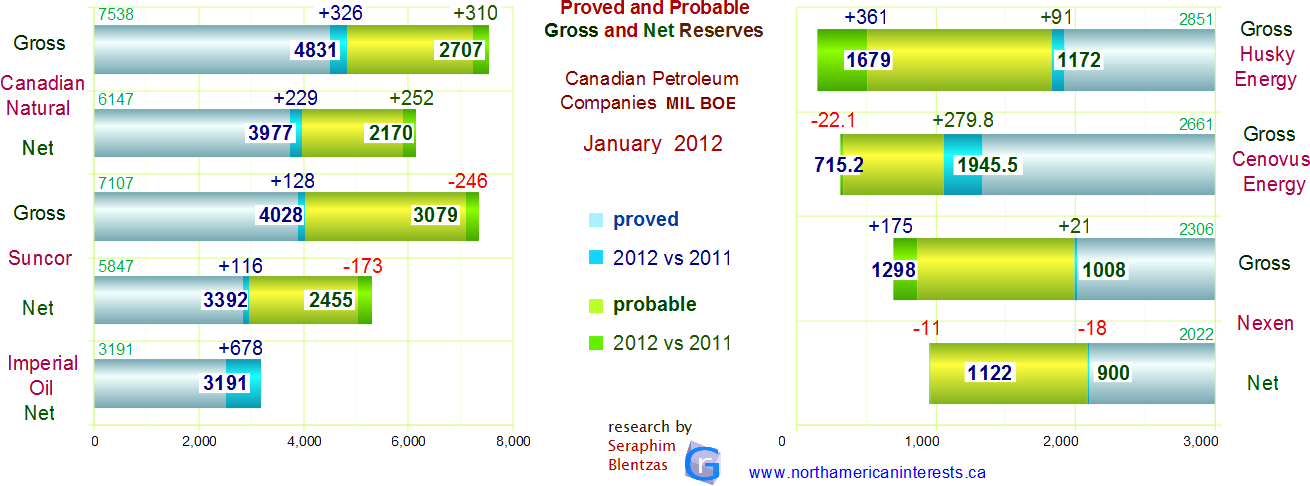
| 2012 | 2011 | ||||||||||||||||||||||||||||||||||||||||||||||||||
|---|---|---|---|---|---|---|---|---|---|---|---|---|---|---|---|---|---|---|---|---|---|---|---|---|---|---|---|---|---|---|---|---|---|---|---|---|---|---|---|---|---|---|---|---|---|---|---|---|---|---|---|
| Gross | Net | Gross | Net | ||||||||||||||||||||||||||||||||||||||||||||||||
| Oil | NGas | Total | Oil | NGas | Total | Oil | NGas | Total | Oil | NGas | Total | ||||||||||||||||||||||||||||||||||||||||
| Mboe | Bcf | Mboe | Mboe | Bcf | Mboe | Mboe | Bcf | Mboe | Mboe | Bcf | Mboe | ||||||||||||||||||||||||||||||||||||||||
| CNRL | 6521 | 1017 | 7538 | 5257 | 890 | 6147 | 5941 | 5766 | 6902 | 4818 | 5088 | 5666 | |||||||||||||||||||||||||||||||||||||||
| Suncor | 6774 | 333 | 7107 | 5607 | 240 | 5847 | 6885 | 340 | 7225 | 5639 | 265 | 5904 | |||||||||||||||||||||||||||||||||||||||
| Imperial Oil | 3121 | 422 | 3191 | 2453 | 576 | 2549 | |||||||||||||||||||||||||||||||||||||||||||||
| Husky Energy | 2347.4 | 3020.3 | 2850.8 | 1894.9 | 3023.6 | 2398.8 | |||||||||||||||||||||||||||||||||||||||||||||
| Cenovus | 2395 | 1594 | 2661 | 2103 | 1800 | 2403 | |||||||||||||||||||||||||||||||||||||||||||||
| Encana Corp | 153.8 | 15499 | 2737 | 133 | 13441 | 2373.2 | 109.3 | 16054 | 2785 | 93.3 | 13775 | 2389.2 | |||||||||||||||||||||||||||||||||||||||
| Nexen Inc | 2033 | 1628 | 2306 | 1775 | 1478 | 2021 | 1989 | 792 | 2120 | 1791 | 738 | 1914 | |||||||||||||||||||||||||||||||||||||||
| Talisman | 866.7 | 8136.6 | 2222.8 | 754.0 | 6632.2 | 1859.4 |
Only top 11 shown. Canada is home many other major companies including ARC Energy; Pacific Rubiales Energy (shares interest in oil fields responsible for a third of Colombian production). Calgary is home to over 2400 oil and gas companies. Caisse de depot et placement du Quebec which manages among other things the Quebec pension plan, owns 5.9% of Enbridge ($2.7 billion), total interest in oil sands companies is $5.4 billion. Carl Icahn owns 6.96% of TLM.
Investor positives - Cenovus Energy - WCS and WTI price difference currently near 5-year low (2013) bodes well for heavy oil producer Cenovus. Owns 50% interest in 2 ConocoPhillips American refineries (downstream) - this is great for Cenovus Energy since this gives it stable access to American refineries for heavy oil upgrading and refining - glut of supply of Canadian crude in Northern states is one reason why other Canadian producers are having a difficult time getting their oil to market (pipeline tracks limit their access to other refineries) - this makes the Illinois refinery particularly valuable. Over the next 5 years Cenovus is investing $5b in its current projects Encana - For the first time company leaders are focused on increasing shareholder value. At $3.60/mmcf (July 2013) the price of natural gas is up almost $1.00 versus the previous year but EnCana stock is 20% lower. - share buyback plan. EnCana 2013 exit year strategy: oil liquids output to 70th bpd. Suncor - organic growth, dividend growth has recently put it ahead of cnrl and imperial oil (13c vs 12c). August 2013 - Berkshire Hathaway reveals $620m invested in major oilsands player Suncor. Cenovus Energy - 2013 9M oil royalties down : $6.91->$5.28/bbl, Christina Lake +63% -> 52,732 b/d. earnings 3q +28% but 9M -35%. Husky Energy - 3q2013 profit -3% as refinery crack spread narrows: 9-months $24.45 vs 27.50 but 3-mo $15.86 vs $35.18.
Crescent Point Energy major moves in 2012 boost total output by 34% (crude +35% ->89,704 bbls/d, gas +25.7% -> 9,047 boe/d). 2012 deals: Jan 25 - adds 980 bpd in SW Manitoba, March 15 - Takeover of Wild Stream Exploration adds 5,400 bpd in Shaunavon, Saskatchewan, March 16 - Deal with PetroBakken involves 2,900 bpd light oil SE Saskatchewan, April 16 - Sells 900 boe/d 80% oil in Alberta, May 1 - Takeover of Reliable Energy Ltd and its 1,000 boe/d light oil resource in SW Manitoba, June 1 - Agreement closed involving 2,900 boe/d 98% oil, June 20 - Takeover of Cutpick Energy Inc and its 5,600 boe/d resource near Provost, Alberta (65% light oil), July 17 - Sells 225 boe/d natural gas assets. How did all the moves impact annual sales? 2012 oil revenue +24% $2.643b, gas -15% $51.813b. CPE Deal of the Year : November 29, 2012 acquisition of UTE Energy Upstream Holdings (private) for $861m - gave it 7,800 bpd oil production, 400+ 100% owned low risk vertical well drilling locations, +55.1m 2P reserves (37.6m proved). Total revenue +23% even though average price realized down: oil -8.1% -> $80.51, gas -32.6% -> $2.61, total -8.3% -> $74.57. CPE quarterly dividend high at 69c a share.
Crescent Point 2014 nine months production up, prices up, but royalties also up - output : oil (+16.4%), natural gas (+10.2%) ; avg selling price: oil $87.6->$93.58 (+7%), gas price $6.51->$5.24 (+49%); royalties paid per barrel: $14.95->$15.79 (+6%) netback $50.42->$52.87
Crescent Point fiscal 2013: total boe production average up 21.8% to 120,288 boe/d (liquids 89,704-> 109,129 bpd / gas 9,074-> 11,159); revenue 3.526b up 31% earnings $144.876m (vs 190.653m down 24%) but operating income up 60% to 485.688m; fewer acquisitions mean lower transaction costs -65% to $5.761b; long term debt +18% to 1,734.114m; average selling price up for crude oil (+7% -> $86.32) and natural gas (+38% -> $3.61); total up 8% $74.57 -> $80.32; royalties per boe: $12.95-> $14.67 +13%
9M2013: selling price: oil $87.60/bbl (vs $81.16), gas $3.51/mcf (vs $2.31), combined $81.39 (+8%), royalties/boe: $14.95 (vs $12.97). 3Q2013: oil $97.54/bbl (vs $78.20) gas $3.01 (vs $2.40), combined $90.38 +26%. royalties/boe: $17.59 (vs $12.47).
Syncrude April 30, 2013: Unplanned outages reduce 2013 full year production estimate by 5% to 100-110 million boe. Average daily production in the first quarter of 2013 was 260,400 boe/d (-12%). 2013 1q earnings down -44% on lower output and lower crude price (total revenue down -11% to $961m). The company is part owned by Sinopec. Core properties are joint ventures with Cnooc, Imperial Oil.
CNRL: 9M2013 - total production boosted by significant growth in the 3q (584,577 -> 619,800 bpd 70% liquids/30% gas). 3q output pushed higher by much higher increase in oil sands mining and upgrading unit (95,074 -> 104,627; by comparison for the 9-month period that unit was up only 83,004->91,304 so the 3q really was amazing). North Sea production down (3q 15,481 -20%, 9m 17,664 -12%). 3q record cash flow of $2.45 billion +71%. WCS differential: 9M 23% (stable) 3Q 16% (vs 20%). realized pricing per barrel: 9M $75.32 (vs $74.60), 3Q $89.24 (vs $75.10). 9M capital expenditures - $5.183b +14%. 3Q2013 cash flow highest on record at $2.45b.
2012 reserve replacement ratio of 246% (5% increase in reserves equals 2.46X full year production); in 2011 the ratio was 390%. 2012 bitumen royalties of $4.34/bbl (+8.8%). synthetic crude oil sands output : 2012 86,077 bbls/d +45,643. fiscal 2012 production expense: company average : $13.14/bbl (+6%); oil liquids $16.11/bbl (+2%), gas $1.31/mmcf (+14%); oil highest in North Sea ($53.53 +44%) lowest in North America ($13.4 +1%); gas highest in North Sea ($3.75 +0.92) lowest in North America ($1.28 +0.16). profit down $0.75b vs +$1b in 2011.
Husky Energy HUSKF: Major gas exploration project is in Liwan, China. Husky Energy is also contemplating exploration in Greenland. Has interests in White Rose (Canadian East Coast) which Suncor Energy owns 26.125% of. 2011 reserve replacement ratio: 180%. Reserve life index now at 10.3 years. Husky produces in western and atlantic canada. International production comes from China Wenchang (light crude and ngls) - 7,400 b/d 9m2013 (2012: 8.3, 2011: 8.6).
9m2013 average sales price realized for light crude oil and ngl: -2% to $102.48 (2012:101.06, 2011: $103.15); sales price for light crude oil was up significantly in the 3q2013 from $90.5 --> $107.83 but was stable for medium crude, heavy crude, and bitumen. Natural gas was down $2.48 --> $2.66 (3q), $2.39 --> $3.15 (9 months). 3q13 earnings hit by refining crack spread -55% to $15.86.
Talisman Energy TLM: 9M2013: December 2012 sold 49% interest in Talisman Energy UK to Sinopec subsidiary Addax Petroleum for $1.5 billion - that move is part of the reason North Sea output down 67,000 bpd in 9m2013. Carl Icahn ups stake to 6.96%.
9M2013: gross production 368th b/d (2012 437, 2011 421). net production 285th (2012 358, 2011 348).
biggest difference between gross and net production: southeast Asia oil: gross 43th bpd (up from 42th) net: 23th (down from 25th). Total natural gas: gross 1433 mmcf/d (vs 1609), net 1143 mmcf/d (vs 1315). 2011 reserve replacement ratio: 157% @ cost of $20/bbl. Replacement costs -50% last 3 years.
production from assets sold: 9M2013: nothing 9M2012: 5,000 bpd (gross), 4,000 bpd (net) 9M2011: 8,000 (gross), 7,000 (net)
Talisman Energy fiscal 2012 - sold 49% of British operations to Sinopec for $2.5 billion (North Sea). Also during the last three months of 2012 the company announced a major oil discovery in Kurdistan. For the 2012 year, cash flow (-12.0% to $3.022b), earnings (-83.0% to $132m) down significantly. Financials were down in 2012 due to 1) lower North Sea production 2) lower gas prices in North America 3) higher operating costs. gross production: Oil 162th (-16th) + N.Gas 1582 bcf (+91) = 426 boe (steady)
Imperial Oil Esso IMO: 9M2013: capex $6,453m +66% (vs $3,890). Maintenance at Syncrude lowered 3Q gross production by -21th bpd; refinery throughput 451,000 bpd (flat). Kearl expansion now 58% complete. Lower industry refining margins affected earnings bigtime : 3q2013 -38% to $647m | 9m2013 -34% to $1,772m.
Between 2010 and 2011 the number of wells Imperial Oil had interests in declined significantly for natural gas (gross: 5372--> 2404, net: 2833--> 847) but went up for crude oil (gross: 883--> 1070, net 588--> 734). Bitumen wells down also (4358--> 4068). 2011 exit-year 60% of net proved reserves (3.191 billion boe) are at undeveloped properties up from 47% in December 2010. Today (2012) 77% of oil reserves are in bitumen, up from 70% in December 2010. Feb 26, 2013: IMO acquires 50% working interest in assets formerly belonging to Celtic Exploration from ExxonMobil Canada ($1.55 billion). 76% of Celtic's 128m barrels of 2P reserves are in natural gas.
9m2012: earnings up +13.7%: $2366m --> $2690m or $2.77 --> $3.16 per share. gross production decreased (299,000 --> 281,000) due to planned maintenance at Cold Lake and Syncrude, and fewer natural gas assets than in 2011.
gross share of syncrude output: 75,000 bpd --> 70,000 bpd -- net share of syncrude: 70,000 --> 67,000
9m2012 gross -> net production: Cold Lake: 154 -> 120, Syncrude: 70 -> 67, Conventional: 20 -> 15, Natural Gas: 194 -> 197
Crescent Point Energy CPG: Market cap is larger than Nexen and Penn West however production is much lower. The company anticipates 2012 exit-year output of 93,000 boe/d, 90% light medium oil.
In January 2012 CPE acquired Wild Stream Exploration for $770M which immediately boosts CPE production by 4.4%.
Encana ECA: On December 18, 2012 announced that it and Ferus LNG will build a 190,000 litre per day liquefied natural gas plant near grand prairie, Alberta. when operational end of 2013 will be the first in Canada to produce high quality LNG fuel for use in high horsepower vehicles. 3q2013: major layoffs - 20% of workforce to be laid off (800 people). Company aims to improve its balance sheet while also narrowing focus down to to five key resource plays (from 30). Is also creating a separate company to handle mineral rights and royalty interests in Southern Alberta (ipo during summer of 2014).
In 2011 Encana saved $12m by using natural gas instead of diesel in drilling units.
9m2012: profit loss of $2.714 billion due to test impairments ($2.888 billion after tax), $1.244 billion in the quarter. 60 cent dividend paid (20c each quarter). natural gas price $4.75 per mmcf ($4.91 in 3Q).
9m2012: cash flow declined -$505 million --> $2,728 million due to lower commodity prices and natural gas production volumes. capex: $2.696 billion down from $3.602 billion.
Acquisitions: $361m worth of land in Canada and the United States (down from $468m last year)
divestures: $2,698m $2,505m of which were transactions involving the Canadian division; sales of two natural gas processing plants in BC to Mitsubishi and Toyota corporation. Dec 2011: sale of $836m assets in North Texas.
Nexen Inc: 2012: Nexen's royalty rates paid on natural gas were highest in the USA, accounted for 7.9% of gross prod (126--> 116) vs 5.0% in Canada, 0% in UK. Oil Royalties: UK was virtually nothing (104.9 gross --> 104.8 net), long lake bitumen (15.9--> 15.1), syncrude (21.2--> 19.6) usa (9.9--> 9.0). Yemen remained the highest (41.3--> 23.1). Feb 24: 1st oil from Usan field, offshore W.Africa. 2011: Nexen invested $2,516 m in oil and gas activities, causing reserves to increase 73M boe for proved, 175m boe for probable.
Conventional oil: Nexen's assets are in the North Sea, deep-water gulf of Mexico, offshore W.Africa. Key international projects: Usan, Golden Eagle, Blackbird, Telford TAC, Rochelle. International projects received 60.6% of capex in 2011 ($1525m/2,516) down from 63.6% in 2010 ($1598m/2513 in 2010). Oil sands: Capex in 2011 was $521m up from $347m in 2010. Key assets are at Long Lake, Kinosis. Shale gas: BC, Canada, received $59m in capex (down from $211m).
Prior to 2011, the company reported no proved Bitumen reserves since Dec 31, 2008 when proved bitumen was 282M boe (net).
Netback per boe is highest at oil sands syncrude operations (C$55.85/boe, highest in 2nd qtr $57.99) and UK ($49.95/boe highest 2nd qtr at $54.52); The UK will be the source of 52.9% of future revenue based on net present reserves using a discount rate of 10%, about 30% will be from Canada. 27% of production originates in Canada with a lot of the rest coming from the North Sea.
July 24, 2012 UPDATE: Nexen agrees to a $15.1 billion takeover (61% premium) by CNOOC of China. The deal is the biggest foreign investment by China. On December 7, 2012 Canadian prime minister Stephen Harper approved the takeover of Nexen by CNOOC. He did however warn that future takeovers valued at more than $330 million involving state owned enterprises, likely will not be approved unless they are 'exceptional' circumstances. He noted that the oil sands are home to 60% of global oil not under state control and that it is in Canada's interest for that not to change. Canada's approval comes just after the European Union put its stamp of approval on the deal.
Nexen's realized prices: oil was highest in Yemen (108.11 up from 81.86). Natural gas realized price was highest in UK (c$7.42/mmcf up from $5.28 in 2010). In the USA ($4.21 -0.76) and Canada ($3.44 -0.50) it was low.
PennWest Petroleum PWE: In early-mid 2012 the market price for Canadian oil (WCS) was as much as $25 lower than US oil prices making it more difficult for Canadian producers to adjust to lower overall prices. In it's second quarter (2012) Penn West cited that as the main reason why net income was down -13.3% that quarter; To adjust, the company laid out a new plan that involves capital spending cuts (-10%) and selling assets ($1.5 billion worth). 2012 full year production estimate was lowered from 168,500 - 172,500 bpd --> 165,000 - 168,500 bpd.
9M2012: liquids make up 66% of production mix up from 63%. netback -12.5% to $26.49 boe ($30.28). capex -27% to $1,053m ($1,443). risk lowered earnings from a gain of $138m in 3Q2011 to a loss of $67m in 3Q2012. Quarterly dividend of 27 cents has been unchanged for over 2 years.
9M2012: heavy oil : 17,534 bpd (-2%) or 10.7% of total production; 9M2011: heavy oil: 17,894 or 11.1% of total production.
Canadian Natural Resources CNQ: Production base is diverse and that enables it to withstand fluctuating commodity prices and regional production inconsistencies. In 2011 average sales price of crude oil (net of transportation and blending costs) was $77.46/bbl +17.7% vs 2010 ($65.81/bbl). Crude oil sales price was significantly higher in the 4q vs the 3q ($85.28 vs $73.80) consequently royalties paid were also higher ($12.3/bbl over the fully year 2011 up from $10.09/bbl in 2010; $15.53 in 4q up from $11.52 in the 3q).
Crude oil and natural gas prices were highest in the North Sea ($108.56 up from $82.49) and Offshore Africa ($105.53 up from $78.93) but still very low in North America ($72.17 up from $62.28) and that brought the company average up only 17.7% to $77.46 (from $65.81 in 2010). Natural gas prices Offshore Africa were significantly higher at $9.56/Mcf ($6.63 in 2010) compared to only $3.64 and $4.07 in North America and North Sea, respectively. CNRL profited nearly $1 billion more in 2011 than in 2010 ($2643 million +58%) even though revenue was up only +6.9% to $15.507b. For the year, the company paid $294 million more in royalties ($1421--> $1715).
CNRL reserves December 2011: 4.83 billion boe of proved reserves (+7%). 2P: natural gas +25% North Sea (134 Bcf), -6.5% Offshore Africa (129 Bcf), +5.7% North America (5838 Bcf). 96% of production happened in G8 countries making the company's assets fairly stable. 2012 quarterly dividend will go up 17% (0.09 to 0.105). In 2011 CNRL replaced 390% of its production and that caused a jump of 7% in proved reserves.
Note: Exports of natural gas from Canada require the approval of the NEB and Canadian government. Data in table is gross output before royalties. Pacific Rubiales Energy not listed because net production is much lower than it is for these nine companies (even though PRE gross production is greater than a few of them).
Cenovus Energy CVE: 2013 9-month royalties paid down oil: $5.28/bbl (from $6.91) gas: $0.05/mmcf (from $0.03).
oil production anticipated to grow 14% in 2013, oil sands production up 44% in 3Q2012 to 95,000 bpd
9m2013: revenue $13,910 +6%; earnings $720m -35% (9m2012 $1,111m, 9m2011 $1,212m); capex $2,364m -1% (vs $1,842 +32%).
Dec - Sep 2012 Assets: Total Assets +9.9% to $24,384m -- exploration and evaluation assets +44.2% to $1,269m. Christina Lake: production +63% to 52,732 b/d (3q2012 record for single day was 43,500 boe/d (avg 32,000 in 3Q2012), Foster Creek -22% to 49,092.
3q2013 gross oil production: +3% to 176,938 b/d (vs 9m12 +28% to 171th); gas -9% to 523 mmcf/d (vs 9m12 -12% to 577).
table above: Canadian Natural Resources Ltd total proved bitumen reserves +9% to 1.066b (2P +23% 2.122b), oil sands production more than doubled to 86,077. Canadian Oil Sands reserve life based on 2012 production is 42 years (110 million barrels 40.4m net). Cdn Oil Sands averaged 290th bpd output over last 6 years; 2012 production 286,500 bpd (104.9m barrels total) down from 288,400 (105.3m total) despite capex +68.9% to $1.086 billion. MEG Energy Christina Lake can support production capacity of 200th for 30 years, Surmont 100th for 20 years.
Updated 2021