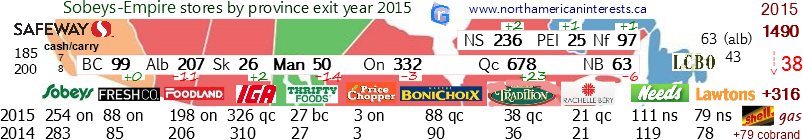
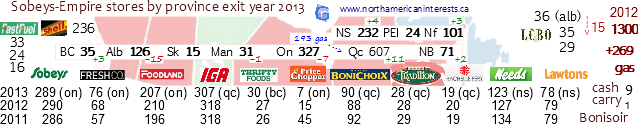
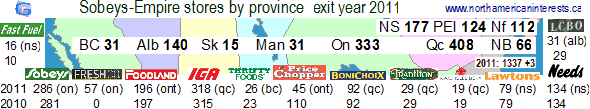
2013: 194 of Metro Inc 564 stores (34%) operate in the discount food sector compared to 257 for Empire-Sobeys (20%, FreshCo/Foodland) and ~30% for Loblaws. Sobeys + Safeway = 1538 stores + 322 gas stations (236 shell, 24 fast fuel, 62 safeway gas) . FreshCo was launched on May 12, 2010 in Toronto. It started out by taking the former locations of Price Choppers stores (87 in Ontario). To celebrate, Sobeys offered new customers triple A beef.
info is followed by data on Loblaws
2013: Sobeys same store sales growth of +0.6% in the final quarter of 2013 is down from +1.2%, +1.3%, +1.8% in the previous three quarters (3rd 2nd 1st) and +0.7% in 4q of previous year. By comparison same-store sales growth at Loblaw Cos each of the corresponding four quarters (most recent first) is +1.1%, +2.8%, -0.2%, -0.2%, +0.2%, -0.7% (2nd, 1st, 4th, 3rd, 2nd, 1st).
All three seemed to have their strongest quarters in terms of same-store sales in 1q2013: Loblaw +2.8% (Mar'13) vs Sobeys +1.8% (Aug'12), Metro +1.5% (Dec'13).
Fiscal 2013 Sobeys +1.3% vs +1.4%.
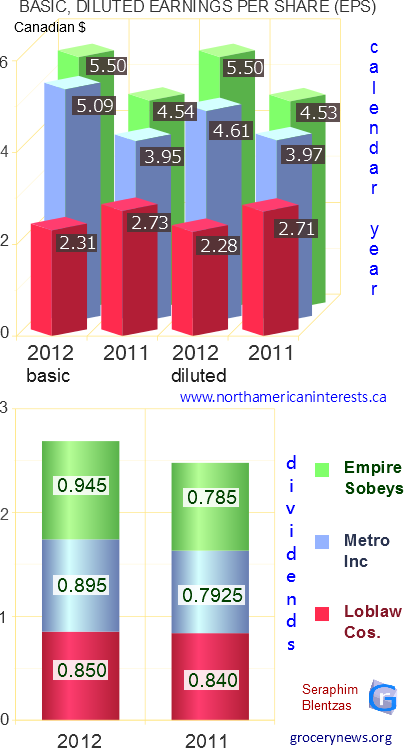
Sobeys 2011 same-store sales growth by quarter +1.2%, +1.9%, +1.7%, +0.7%. Looking at it from a calendar-year perspective, Loblaw Cos 1.3% in its 3q was lower than Sobeys 1.7% in its 1q. Sobeys led the industry in same store sales for seven consecutive years). For the investor out there consider this: Annual Sobeys dividends have grown consistently year in and year out, per share they were at 40c in 2004, 60c in 2007, 66c in 2008, 70c in 2009, 74c in 2010, 80c in 2011 and 92.1c in 2012 (45.6c 1H, 46.5c 2H), 95.0c in 2013 (45c 1H, 50c 2H), 52.0c in 1H 2014.
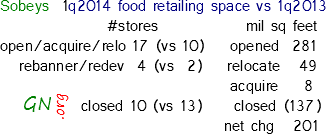
First Half Fiscal 2015 (ended Nov 1) : 26 weeks- net earnings of $240.0 million +2.5% (1q $123.1/2q $116.9) on group revenue of $12,217.8 million +35.6 (1q $6,227.7/2q $5,995.1). earnings much improved when considering only continuing operations: +67.7% total -> $240.0m; food retailing +57.9%-> $213.9m. revenue/earnings by segment: food: $9,011.7-> $12,217.8m +35.6% (1q $4,594.9/2q $4,416.8) , investments other $4.2m-> nil down. net earnings breakdown: food: $135.5m-> $213.9m (1q $113.5/2q $100.4) investments other $98.7m- >$26.1m (1q $9.6/2q $16.5). first half dividend: 54 cents (+2c), same-store sales up: half +1.6% (vs +0.1%), 2q +1.7% (vs +0.2%), 1q +1.3% (vs +0.1%), effective tax rate 25.2% 2q15 (vs 26.3% 2q14).
Fiscal 2014 (ended May 3) : 52 weeks- In just 2 quarters Canada Safeway has managed to boost Sobeys annual sales by $2.806 billion or 16.13% (total company sales up 20.6% to $21.0b). Organic growth by Sobeys accounted for $394.1 million of increase in sales (price inflation / new stores however same-store sales were flat on the year). Gross Profit: Safeway stores boosted gross profit and gross margin by $502.1m and +0.28% (23.46% vs 23.18% without) respectively; gross margin up to 23.93% vs 23.14% last year. Sobeys total gross profit increased by $1.003 billion or 25.0% from $4.013b last year. net earnings: Sobeys: +$349.2m adj (vs $325.3m) or -$87.4m undjusted / Safeweay +$78.9m. consolidated earnings: food retailing $121.8m (vs $334.2m), investments $113.6m (vs $45.3m) with $84.2m coming from discontinued operations ($78.2m from empire cinemas). fiscal 2014 free cash flow $869.1m (vs $430.2m). food retailing totals: revenue 20.99 billion (up from $17.4b).
13 week quarter: Empire adjusted net earnings are $131.3m (vs $95.7m) $112.1m from food retailing (vs $80.6m), $19.1m from investments (vs $15.1m). unadjusted, the company earned a mere $0.8 million (food retailing loss of -$17.6m vs +$87.4m combined with +$18.4m gain from investments (vs +$18.5m). total consolidated revenue: Food: $5937.0m (vs $4256.8m) ; investments: $0.5m (vs $0.6m). operating income: Food: $6.0m (vs $128.8m) , investments: $16.9m (vs $21.5m) down due to real estate partnerships ($10.9m vs $13.7m) / crombie reit oper.inc up $4.9-> $6.9 million. Adj net earnings: food: $112.2m (vs $80.6m) , investments: $19.1m (vs 415.1m). 4Q2014: Funded debt to capital ratio at 38.0% down from 40.6% , net earnings from continuing operations: $1.5m ($0.02 per share) vs $102.5m last year ($1.51 per share). free cash flow is $626.1m (vs $187.5m).
3Q2014 (ended February 1) : 12 weeks- The Safeway acquisition starts to show up in results both positively ($1.62b of the $1.73b in new sales attributable to Safeway / organic sales growth at 2.7%, $113.3m) and negatively (funded debt to capital ratio up 21.6-> 40.6% (funded debt to ebitda 8.5x, up from 16.8x) / effective tax rate up 27.7-> 72.6% [39 weeks tax rate 28.6% vs 27.1%] ). net earnings down thanks to higher finance costs, lower operating income, offset by lower income taxes : earnings $6.4m $0.07/share (vs $71.4m $1.05/share). adj earnings $77.3m 0.84/share (vs $75.8m $1.11/share). consolidated revenue up 40.4% ($4287.5-> $6017.6m), food retailing sales up 40.5% ($4274.2-> 6004.4m) [39 wks +14.6% -> $15016.1m); food retailing revenue using reclassifications +40.4% ($4284.8m-> $6017.1m) [ 39 wks up 14.6% $13134.2-> $15050.8m], adj ebitda up 37.5% ($201.8-> $277.4m). same store sales down -0.2% (vs +1.2% 3q13). by comparison ss sales was +0.6% for Loblaws / -0.5% for Metro. costs: finance costs up 198% $12.5-> $49.7m .. $33.8m in higher interest expense is main driver here (new debt from Safeway deal). Empire's total asset value is up 78.5% ! $6958.9m (Feb 2013) -> $12,420.7m (Feb 2014).
Investments Other (now quoted to exclude Empire theatres both for the current period and previous period - theatre operations now listed under discontinued operations) : revenue $0.5m (vs $0.7m).
2Q2014 (ended November 2) : 13 weeks- Empire Company earnings totaled $169.2m (+84.1%): that represents 3.82% of total revenue ($4.4285b +1.8%), up from 2.11% a year earlier; [Food Retailing revenue: $4.4277b +2.0% earnings $56.3m -32.5%; investments other revenue $0.4m (vs $6.5m), earnings $4.2m (vs $6.9m)]. Only $60.5m of consol earning came from continuing operations (-33%), the other $108.7m from discontinued operations (+$107.1m). $105.3m of consolidated net earnings attributable to the sale of Empire Theatres, profit from continuing operations down $29.8m. same-store sales up +0.2% vs +1.2% last year (2q13), -0.2% last quarter (1q14): these numbers compare well against Metro Inc (-1.8%) but trail Loblaw (+0.4%). Total company operating margin down (qtr: 2.4% vs 3.18%, half 2.66% vs 3.54%). Total basic net earnings per share: $2.49 (vs $1.35); half $3.45 (vs $2.94). Funded debt to total capital ratio: 22.4% Nov;13; 20.7% May'13; 21.5% Nov'12
operating income: Quarter $106.4m (vs $138.2m) | Sobeys $99.8m (vs $127.5m); Half $240.3m (vs $313.2m) | from Sobeys $226.8m (vs 283.5m). Decrease attributed to highly competitive environment.Other sources of operating income: Quarter : Crombie REIT $5.4m (vs $4.2m); Genstar $8.0m (vs $4.6m); Other -$(6.8)m vs +$1.9m. <- includes organizational realignment and restructuring costs of $8.4m & dilution gains of $4.1m none of which were expenses last year.
adjusted: net earnings from continuing operations a more respectable $78.1m vs $81.7m previous year.
earnings up on account of cost controls ; operating margins were weaker.
Effective tax rate: second quarter 2014: 26.3% (steady), first half 2014: 25.3% (vs 26.9%) <- timing of realization of tax benefits. Trailing 4-quarter ebitda | interest expense ratio down to 12.9X at 2Q end (vs 16.5X last year). Finance costs up +$7.8m to $13.3m.. why? because interest expense attributable higher debt capacity due to the acquisition of Safeway (closed on November 4). offset by increase in total finance income +$7.7m (higher interest income earned from investment of subscription receipts).
Half : Company earned $234.2m (+34.7%): that represents 2.59% of total revenue ($9.0379b +2.0%), up from 2.25% a year earlier; Food Retailing revenue: $9.0337b +2.1%; investments other operations $4.2m (vs $8.5m). Food profit: $135.5m (vs 179.1), investments: $7.6m (vs 19.3) + $105.3m from asset sales. Total funded debt $1140.5 billion (+17.6% vs May 2013, +17.1% vs Nov 2012).
1Q2014 (ended August 3) : 13 weeks - Empire Co earnings down -39.6% ($107.6m -> $65.0m) to only 1.41% of revenue (+2.2% -> $4,609.4m) though when adjusted to exclude one time items, earnings not as bad (-12.6% -> $89.7m) ; eps from discontinued operations dragged down bottom line (-26c per share vs -1c previous period). income tax rate down: 27.4-> 24.6% thanks to timing of tax benefits.
Funded debt: Sobeys -11.3m but investments +8.9m. $10.1m pre tax in transaction costs associated with the acquisition to Safeway factored into operating income. ebitda (-14.8% -> $260.7m).
the good - Sobeys free cash flo
 w to $49.7m, funded debt to capital ratio now only 19.9% vs 21.5%. operating income $175.0-> $133.9m: Sobeys -18.5% to $127.0m, investments/other -63.9% to $6.9m (previous period incl dilution gains of $11.4m, Genstar also down $4.6-> $3.1m). net earnings from continuing operations: $108.1-> $82.6m or $1.59->$1.21 per share : Safeway transaction costs -$7.1m.
 Sobeys accounted for $16.5m/$25.5m of the difference (divestment of Empire Theaters partly responsible), investments (-73%-> $3.4m). Sobeys oper inc $79.2m (-17.2%). consolidated net earnings: $65.0m (food $79.2 / invest -$14.2m vs +$11.9m prev period) or 96c eps basic (vs $1.58). remeasurement of assets + transaction costs totalled $18.3m net of tax - that widened net loss from discontinued operations to $17.6m up from $0.5m prev period. consol earnings per share -39.9% ($1.58->$0.95). same-store sales weak at -0.1% but not surprising (ss-sales also lower at Metro Inc -0.9%). Sobeys square footage +2.4% to 29.7 million sq feet. another factor to consider when looking at fall in bottom line is oper.inc from outside retail,realestate -> -$2.9m vs +$8.9m last yr.
Sobeys - the food retailing segment reported sales of $4,5949m (+2.2%) or $4,6060m when reclassification of lease revenue is included (+2.2%). food retailing profit: $79.2m (vs $95.7m -17.2%). Investments,other contributed $3.4m to sales (+$1.4m); consolidated revenue 4.6094b (+$100.3m). sales from discontinued operations bulk of which is Empire Theatres: +13.2% ($48.6-> $55.0m). total assets by segment Aug-Aug: food retailing $6455.1m (vs $6215.0m), other $2526.2m (vs $623.9m). Interest in Genstar, Crombie now at 42.7%, 40.7% respectively.
4Q2013 - Fiscal 2013 (ended May 4) quarterly : Empire Company paid out $16.3m in dividends (+$1.0m) or 26c a share (+8.3% versus every other quarter in current fiscal period). quarterly revenue $4308.9m (+235.1m +5.8%) of which Sobeys contributed $4,259.2m (+$233.3m +5.8%). Excluding new revenue from 236 gas stations (+$269.7m in qtr) Sobeys revenue increased $94.9m +2.4%. qtrly same-store sales +0.6% not bad considering at Metro it was 0.0% in qtr ended March 16. Net Earnings up +16.6% $92.1-> $107.4m or per share +17.0% $1.35-> $1.58 ; adjusted +10% 89.6->$98.6m, +9.8% $1.32-> $1.45/sh. adj oper.income $155.1m (up $18.7m or 13.7%). net earnings breakdown : Sobeys $89.1m (+$7.9m or 9.7%), Investments $18.3m (+$7.4m or 67.9%), adjusted : Sobeys $82.3m (+$3.1m or 3.9%), Investments $16.3m (+$5.9m or 56.7%). ebitda - $247.0m +22.8%
fiscal year Sobeys sales +8.4% $16,055.5 -> $17,402.7m with $1,031.6m of the difference coming from new gas stations (Shell gas stations are considered part of food retailing division Sobeys); excluding new gas revenue Sobeys increased $445.8m +2.8%. empire total revenue 17,612.7m +8.4%. same-store sales up +1.3% on the year. Net Earnings up +13.4% $339.4 -> $384.8m, adjusted +13.8% $322.7 -> $367.3m, per share +13.2% $4.99 to $5.65. adjusted +13.7% $4.74 to $5.39. adjusted operating income $562.4m (up $48.5m or 9.4%).
operating income breakdown : Sobeys $515.3m (+$39.5m or 8.3%), Investments $69.5m (+$11.0m or 18.8%). adjusted: Sobeys $504.7m ($39.1m or 8.4%), Investments $57.7m (+19.5% or $9.4m).
net earnings breakdown : Sobeys $339.9m (+$35.8m or 11.8%), Investments $44.9m (+$9.6m or 27.2%), adjusted: Sobeys $331.0m (+$36.4m or 12.4%), Investments $36.3m (+$8.2m or 29.2%).
Accounting for difference between profit and adj profit : +4.0m trans costs related to Safeway, +$1.5m in realignment costs (+$6.7m for year), -$13.8m on gain from disposal of assets (-$22.9m on the year). full year ebitda - $944.1m +67.5%. Funded debt to capital ratio 20.6% (25.0% last year)
42.8% interest in Crombie reit worth $622.7m (up $102m).
 3Q2013 (ended February 3) Sobeys adj earnings +8% to $71.7m. Dividend steady at 24c, debt to capital ratio 24.6% -> 21.6%. Sobeys same-store sales up +1.2%. gross margin for the 39 week period down significantly (24.08% -> 23.03%) on account of lower margin fuel sales (excl that, gross margin steady at 24.25%). Quarterly revenue at Sobeys up by $348m -> $4.2848 billion; all but $97.1m of the increase in Sobeys revenue is attributable to the acquisition of 236 shell gas stations late 2012.
Excluding that, revenue +2.5% -> $4.0274b, the strong food sales is attributable to price inflation and larger new stores though competition played a negative role (consumers less likely to buy pricier items). quarterly net income down -6% $75.2m, due to $(4.8)m accounting charge, 3q12 included +$9.3m from asset sales; crombie+other investments contributed $6.4m of the $75.2m profit. Earnings adjusted $1.17 per share ($79.6m).
Total company revenue hit $4.34b during the qtr (+9.0%), $13.3038b in the 39 week period (+9.3%).
42.9% interest in crombie reit worth $580 million (+10.0% since start of fiscal year in May). more
2Q2013 (ended November 2, 2013) Sobeys same-store sales increased +1.3% (+1.5% for the half), non-fuel gross margin increased slightly. Sales at Sobeys (+9.1% to $4.3454b from $3.9838b) represents 98.7% of Empire Company revenue (+9.1 to $4.4041b). Just over $257m of the $355.95m change in Sobeys revenue ($515.1m / $750.8m in half) is attributable to 236 Shell gas stations acquired late last year (gas, convenience business is part of Sobeys). Funded debt to capital ratio is 21.5% down from 25.0% due to repayment of $200m non revolving credit facility. Net income for the entire company is up +19.46% to $93.3m (+15.2m) or $1.37 per share from $1.15 (adjusted earnings up +14.4% to $1.26 a share), $85.0m of which came from Sobeys (+24.3%). Empire Co profit increased due to higher operating income ($125.8m -> $140.9m) and lower finance costs ($15.0m -> $12.1m). Operating income is $175.1m (+17.60%). Sobeys was the source of 90.6% of the change in operating income ($127.7m +16.3%). Book value per common share is now $52.31 up from $49.98 (May 2012), $48.02 (Nov 2011). Investments added $8.3m in earnings (-1.4%) on revenues of $61.8m (+11.8%).
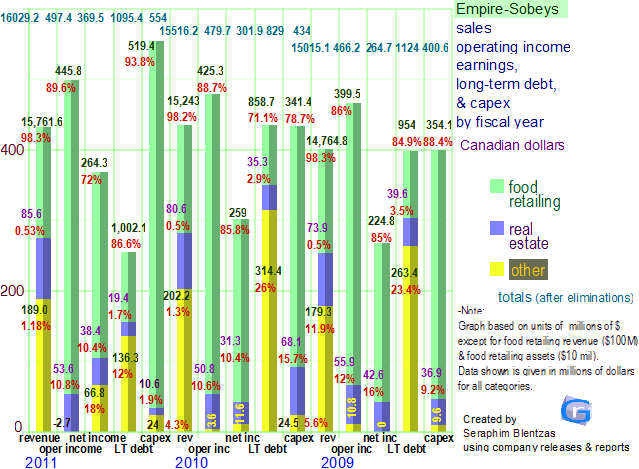
2013 at the half: Same-store sales up +1.5%, food retailing earnings up +21.3% to $182m (most of the increase from gas stations). Total company earnings up +20.86% to $202.2m (+18.2% adjusted to $2.78/sh) on revenue of $8,961.8m (+$771.3m 9.4%). Sales at sobeys $8,849.4m (+$765.2m or 9.5%). Empire's investment's added $20.2m in earnings on revenues of $112.4m (+5.7%). Operating income $316.0m (+41.3m) $284.0m of which is from Sobeys (+15.8%). Graph below was made in November so it doesn't include Nov quarter which was released in December
 1Q2013 (ended August 4, 2013) Sobeys same-store sales increased +1.8% with gross margin steady at 23.15%. Revenue at both Sobeys ($4.51b) and Empire Company (+9.7% to $4.56b) broke into record territory. Just over $250m of the $403.5m increase in total company sales came from the newly acquired 236 Shell gas stations (gas, convenience business is part of Sobeys). Funded debt to capital ratio is 21.5% down from 25.5%. Net income for the entire company is up +22.08% to $108.9m or $1.60 per share from $1.32 (adjusted earnings up +21.6% to $1.52 a share). Operating income is $175.1m (+17.60%).
  4Q2012 (ended May 5, 2012) Sobeys same-store sales increased +0.7% qoq. Sales at Sobeys food business was $4.0232b down -1.94% from $4.1026b last year due to an extra week last year (14 vs 13 this year). Quarterly profit from Sobeys food business was $79.1m (+4.8%) or $1.17/share (+5.4%) representing 88.4% of Empire's total profit ($89.5m +10.1%). Sales attributable to investments/other was up +7.2% to $50.6m. Ebitda from Sobeys up +5.27% to $203.7m (from $193.5m). Ebitda margin 4Q is 5.5% up from 5.06%. funded debt/capital 25.0%.
For the year, Sobeys sales up +1.26% to 16.0446b (out of Empire's total revenue of $16.2491b), profit was up by $6.8m to $304.1m (out of Empire's $339.4m down -$61.2m but $76m of that is due to an artificial gain from the sale of 27.5% of Wajax Income Fund). Sobeys accounted for 91.5% of ebitda ($801.8m/$876.6m) down from 91.96% in fiscal 2011 ($793.6m/$863.0m). Sobey's operating income was $475.8m (out of Empire's $534.3m) which is steady with last year's $473.4m (out of Empire's $525.7m). In the last quarter
Empire Company handed out a 24 cent dividend up from 22.5 cents in 4Q2011 (Sobey's quarterly dividend increases are relatively new, was stuck at 20c for most quarters prior to Jan 2011).
That pushes Empire's dividend past Metro's 21.2 c dividend. Same-store sales growth for 2012: Metro Inc is now threatening to pull ahead of Sobeys for the year after going +1.7%, +1.0%, +1.0% in the first three quarters of its fiscal year (which ends in September). Sobeys went +1.9%, +1.2%, +0.7% in the last three quarters (2nd, 3rd, 4th). Boosting Metro's performance is its 55% interest in Adonis and Phoenicia middle eastern food markets (54.1% of Metro's revenue change over the 10-months ended June 2012
($173.3m / $320.2m) came from Adonis and Phoenicia). I wrote about Metro's latest quarter 3Q2012 here.
3Q2012 (ended Feb 4, 2012):
Sobeys same-store sales increased 1.2% qoq. However net income for the entire company was down 9.7% to $88.9m or $1.17 per share (-10.7%); Keep in mind though that last year's 3qtr earnings included $28.5m in pre tax expense reduction associated with post retirement benefits. Adjusted net earnings were down only -5.3% to $68.4m ($1.01 per share). Dividend per share = 22.5 cents. Empire's revenue for the quarter was up 2.8% to $3.98b, $3.94b of which came from the food retailing division (+2.9%, Sobeys, IGA, etc). Sales attributable to investments/other was down -2.9% to $47.6m. Ebitda from Sobeys declined by -17.8% in the quarter even though Sobeys gained $11.4m from the disposal of assets. Positive signs: 3rd quarter gross profit margin (profit/sales) increased to 24.1% from 23.9%.
For the nine month period Empire's Food Retailing sales (+3.2% to $12.0213 billion) and profit (+0.7% to $222.9m, profit adjusted +7.5% $213.7m) were up, though ebitda was lower (-0.3% to $598.1m). Sobey's operating income -12.98% to $110.6m but most of that drop is from items not considered part of usual business operations (underlying operating income down only -2.9% to $101.5m). Food retailing net income (net of minority interest) down -11.95% to $72.9m. Consolidated Empire profit for the nine months for all business units is $247.3m (-22.3%) but remember that 107.6% of the drop is because the last period includes a gain from the divestment of Wajax.
Investments/other 9M2012; net income (net of minority interest) up +6.6% to $17.7 million; including minority interest investments/other profited only $24.4 million compared to $$96.8 million in the third quarter last year ($76.2 of the decline is because last year's nine month period includes the sale of the 27.5% interest in Wajax). Empire-Sobey's now owns 44.6% of Crombie REIT down from, 46.5% on January 29, 2011. Interest in Genstar Development Partnership now at 40.7%.
2Q2012 (ended Nov 5, 2011): Sobeys same-store sales increased 1.9% qoq. However all was not rosy in the 2nd qtr; net income was down 45.3% to $78.1M or $1.15/share remember though that $76.1M of the lost earnings are directly related to the sale of Sobey's interest in Wajax Income Fund. Funded debt to capital ratio was lowered to 25.2% from 28.0% the year before. Only 98c/share of Empire's EPS in 2Q11 came from business outside of Wajax so the profit drop isn't too concerning.
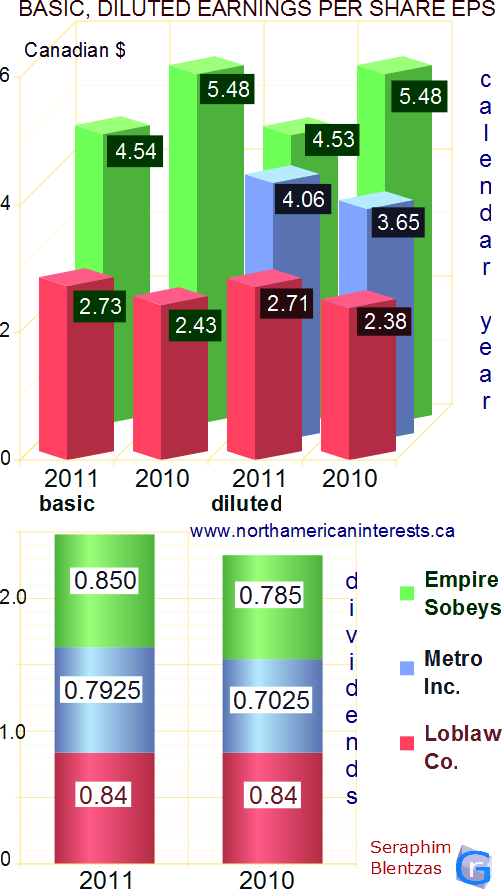
For the 1st half of fiscal 2012 operating income was up 4.37% to $274.7M, ebitda up 4.40% to $444.5M while depreciation was +$5M for the half/ +2M for the quarter. Versus May 2011, long term debt is down a healthy 21.1% to $860.2M but debt due within the next year skyrocketed up to $238.2M from $49.4M in May 2011, $57.1M in 2Q11. Total assets are now at $6,536.8M up a full 1.0% vs May (+$61.6M), +4.3% vs 2Q2011 (+$271M). Dividends paid out at a rate of 22.5c/share totalled $15.3M +12.5% vs last year ($13.6M or 20c/share). In the 1st half of 2012 food retailing accounted for 89.4% of total net earnings compared to 60.4% in 1hlf 2011. The difference is due to gains from the sale of Wajax in 2011 which contributed an additional $76.2m in the 2nd quarter of 2011. Full results for Sobeys at 2Q2012 pdf report. *note: graph to the right will be updated everytime Loblaws releases its data. Empire-Sobeys long term debt: $1.0984 billion as of Nov 5, 2011 (down from $1.168b Oct 2010) $997.8m of which comes from the grocery business (up from $974.2m). Although common shares have been higher year in, year out, preferred series 2 shares have not ($1.13 in fiscal 2008, $0.78 in 2009, $0.44 in 2010, $0.52 in 2011).
Loblaws 2q2014 (ended June 14, 2014) 12 weeks : Loblaws begins including Shoppers Drug Mart in results - retail : organic sales up $116 million or 1.6% to $7,488m - including Shoppers Drug Mart, quarterly sales up $2,725m or +37.0% to $10,097m. 24 week sales not including Shoppers, up +1.2% to $14,583m. quarterly same store sales up +1.8% (excl gas bars +1.7%) positively impacted by Easter (+0.1%). sales growth by sector : food moderate, drugstore down, gas moderate, wholesale apparel down significantly though retail moderate, general merch down.
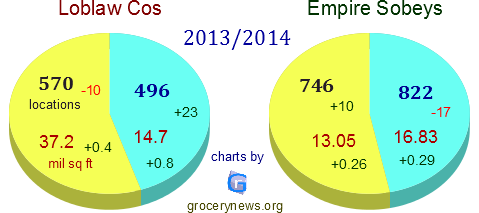
last 12 months: new store openings +22, closures 12, net increase of 0.4m ft2 (+0.8%). shoppers drug mart : 2q14 two new stores and five closures.
Gross Profit: Loblaws $1,840m +12.1% or adj $2,652m +61.5% : Shoppers added an additional $999m (adj). incr attributed to $190m charge related to inventory measurements (incl $622m worth of SDM inventory sold). Ebitda $(117)m -124.3% or $467m adj (-4.3%) + $281m from SDM. (consol adj +55.3%). total net earnings: $(456m) (vs $177m profit) or $1.13 loss per share (vs $0.63 gain) adjusted for acquisitions: $301m (vs $181m) or $0.75 per share (vs $0.64).
Financial Services : revenue 2q: $192m (+29.7%), operating income $38m (+35.7%), ebit $26m (+44.4%). 1q + 2q: $372m (+18.8%), $74m (+27.6%), $49m (+32.4%) respectively. credit card receivables $2,561m +12.4%, annualized yield 13.8% (vs 13.5%), loss rate is 4.7% (vs 4.3%).
Loblaws 1q2014 (ended March 22, 2014) 12 weeks : retail : sales up 0.8% to $7.095b (same store sales up 0.9% vs 2.8% 1q13) but operating income down -22.2% to $217m (1q13 included artificial gain related to defined benefit plan amendments / 1q14 brought down by acquisition related costs) when adjusted for these oper inc down only 0.9% to $226m. Gross profit & Gross profit percentage stable at $1580m & 22.3% respectively. same store sales negatively impacted by the timing of Easter. Adjusted operating margin exactly the same at 3.2%. Adjusted EBITDA up 2.0% -> $416m (margin 5.8% -> 5.9%). retail sales up $58m thanks to.. i) growth in food and gas bar sales.. ii) declines in drugstore, flat in general merchandise, apparel. over the last 12 months, 23 stores opened / 12 stores closed = net increase of 0.4 million square feet. financial services segment : revenue $165-> $180 million (+9.1% thanks to higher interest yield / higher credit card receivable balances: average receivable up 10.2% to $2469m). operating income, ebit both up 20.0% ($36m), 21.1% ($23m) respectively. Choice Properties : net loss of $8 million on revenues of $167m ($150m from the retail segment), operating income $118m ($124m adj), net operating income $115m (cash rental revenue less property operating costs). 1Q2014: Loblaws completes takeover of Shoppers Drug Mart : $12.3 billion transaction included $6.6 billion cash (incl $3.5 billion unsecured term loan facility maturing March 28, 2019) and 119.5 million Loblaw company shares.
Loblaw consolidated info: Assets $20.616 billion (up from $17.460), cash equivalents $2.537b (vs $689m). total quarterly revenue growth $1.2% (vs 3.8%) oper inc $253m [($268m adj) vs $309m $258m adj)], operating margin stable at 3.7%, ebitda margin up 6.1-> 6.3%, net earnings down 39.8% $171m-> $103m; but earnings up when adjusted for one times items: $134-> $139 million. eps per share: 0.61-> 0.37 or adjusted 0.48-> 0.49.
Loblaws 4q2013 (ended December 28, 2013) 52 week year: loblaw revenue growth 2.4% (up from 1.1% in 2012); total revenue $32,371 (vs $31,604). income tax expense increased 8.6% ($210-> $228m) but operating income was up 11.0% ($1195-> $1326m). operating margin unchanged at 1.1%, ebitda margin adj 6.6% (vs 6.5%), retail segment: for the year same store sales 1.1% (vs -0.2%), gross profit margin 22.0% (unchanged), return on avg net assets 10.7% (vs 10.0%). adj margins unchanged for operating 3.7% and ebitda 6.3%. locations and square feet: corporate 570 65,300 ft2 average, franchise 496 29,600 ft2. 26 franchise + corporate stores opened and 13 closed.. net increase 0.8%.. sq footage up 0.4 million.
same store sales: moderate in food, gas bar, apparel. flat in drugstore items.
in 2013 launched 550 new brand products and improved 640 others. control brand sales at $9.6 billion same as year before. cash equivalents up $1079m-> $2260m (treasury bills $322-> $1420m). In the fourth quarter Choice Properties began contributing new revenue to Loblaw ($319m) net cash rental revenue was $222 million. new admin costs amounted to $12m. for the quarter same store sales was a positive 0.6% (vs 0.0% last year). canada cpi index low at 1.9%.
retail segment: sales $31,600 million up $640m or +2.1% vs 2012 ($30,960m). gross profit $6966m (+2.2% vs $6819), oper inc $1185m (+7.7%; adj 1172m -2.1%).
Loblaws 3q2013 (ended October 5, 2013) 16 we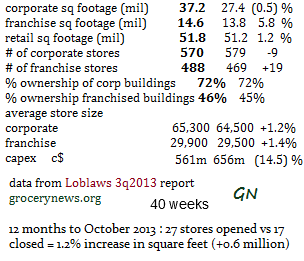 ek quarter: consolidated same-store sales growth at +0.4% (vs -0.2%) : retail same store sales at +0.1% (vs -0.3%). Loblaw Companies profited $154m (-29.0%, per share -28.6% to 55c) on consol revenues of $10,009m (+1.9%, was +1.03% last year). Adjusted eps better at 78c (-3.7%) still misses analyst estimate of 81c (stock down 8% on the day).
ek quarter: consolidated same-store sales growth at +0.4% (vs -0.2%) : retail same store sales at +0.1% (vs -0.3%). Loblaw Companies profited $154m (-29.0%, per share -28.6% to 55c) on consol revenues of $10,009m (+1.9%, was +1.03% last year). Adjusted eps better at 78c (-3.7%) still misses analyst estimate of 81c (stock down 8% on the day). strong sales growth in gas bar and apparel; modest in food, declines in pharmacy, general merchandise. Gross profit margin for retail business down from 2q2013 (21.5% vs 22.3%), loblaw cos puts the blame squarely on increased competition from Walmart and new comer Target. Despite retail sales up +1.5% ($9627->$9772m) gross profit remained at $2,104m meaning cost of goods rose faster than revenue. operating income declined by -$31m ($29m adj) due to lower fx gains, higher depr/ammort offset by labor efficiencies. Adjusted operating margin 3.7% (vs 4.0%), ebitda 6.2% (vs 6.5%). Internal food price inflation flat .. national CPI significantly lower at 0.9% (vs 1.8%).
Metro Inc released its 4q2013 results the same day (same store sales down -1.8%, adj earnings stable at $113.0m but unajusted down 42.4% to $83.6m due to $21m gain from final disposal of 11% stake in Couche Tard/1 less week this period.
Loblaws retail segment: revenue $9772m (+1.5% vs $9627m), gross profit $2104m (same), oper inc $342m (-8.3% vs $373m), ebitda margin 6.2% (vs 6.5%). financial services: revenue $222m (+11.0% vs $200m), oper inc $41m (+28.1% vs $32m), ebit $27m (+42.1% vs 19m). revenue higher due to i) higher credit card receivables (averaged $2297m +11.8% vs $2055m) ii) higher sales from mobile shop. 9 month revenue +14.3% -> $535m. ebit affected by renegotiated vendor contracts (lower costs) and marketing investments (increased costs).
quarterly effective tax rate now 26.7% (vs 27.2%), 9-months 26.6% (vs 25.8%). any increase in tax rate during this period is due to decrease in income tax recoveries.
9-months: revenue $24,731m (+2.5%) [retail $24,181m +2.2% / fin.serv $535m +14.3%] adj ebitda $1631 +4.8% [ebit retail $1517m +1.9%/ fin.serv 464m +137%].
Loblaws 2q2013 (ended June 16, 2013) 12 week quarter: same-store sales growth at 1.1% (vs 0.2%). Loblaw Companies profited $178m (+14.1%, per share +14.5% to 63c) on consol revenues of $7520m (+2.0%, was +1.3% last year). according to Loblaws, sales growth strong in gas bar and apparel; modest in food; flat in pharmacy, negative in general merchandise. Gross profit margin unchanged at 22.3% buoyed by lower transportation costs and less theft. Foreign exchange rate positively impacted margins; depreciation and amortization negatively affected operating margins (4.3% up from 3.9%). Ebitda margin 6.8% (vs 6.4%). Internal food prices inflation flat which is lower than what was reported by the consumer price index (1.5% down from 2.5% last year). retail segment: sales up +1.9% $7236-> $7372m, gross profit +2.0% $1611-> $1643m, operating income +6.9% to $294m. oper. margin 4.0% (from 3.8%). financial services: revenue +6.5% -> $148m, oper.inc nearly doubled ($15-> $28m), ebitda up a whopping 350% ($4 -> $18m). credit card receivables +10.7% -> $2279m with the average yield at 13.5% (up from 12.7%).
2013 half: same-store sales 1.9% vs -0.3% last year. total revenue 14,312 -> $14,722m (+2.9%), oper.inc. 529 -> $631m (+19.3%), earnings 278 -> $349m (+25.5%). retail segment: sales +2.6% $14,044-> $14,409m, gross profit +2.5% $3140-> 3219m, operating income +14.6% to $500m. gross profit margin fell slightly (22.4% -> 22.3%) but operating margin was up a healthy 4 basis points (3.6% -> 4.0%). financial services: revenue +16.8% -> $313m, oper.inc doubled to $58m, ebit $8m -> $37m.
In the last 12 months (June - June 2013) -- Loblaw opened 23 stores, closed 13 stores -- retail space net change +0.4m sq ft. A $7 billion reit handling 415 properties was launched on July 5 and given the name 'Choice Properties'. The ipo was worth $660 million which included $460 million from individual investors and $200m from George Weston Limited (owns 46% of Loblaw Cos, Galen Weston Sr owns 60% of George Weston). Higher effective tax rate this year ! 26%-27% full year 2013 up from 24.9%. capex $1b same as 2012.
Loblaws 1q2013 (ended March 24, 2013) For the 12 weeks ended March 24, Loblaw Companies profited $171m on revenues of $7.202 billion (+3.8%) 86.4% or $229m of the $265m revenue growth came from retail sales ($7.037b +3.4%), impressive considering the national food consumer price index was up only 1.4% this quarter. A collapse of a factory in Bangladesh which housed Joe Fresh Style textile workers hit the company's brand reputation but the company remains optimistic about the situation: Loblaws has compensated families affected by the tragedy and is working to improve working conditions there.
The financial services segment showed a 375% increase in earnings before taxes. Operating income improved markedly due to 1) renegotiated pc telecom vendor contracts 2) higher mobiles sales and more banking services revenue (credit card transactions increased both in number and value). Loblaws anticipates that the initial public offering of its real estate investment company will take place in July 2013, the market value of assets affected by the ipo exceeds $7 billion. same-store sales +2.8%.
Loblaws Fiscal 2012 (ended December 29, 2012) For the 2012 fiscal period, revenue at Canada's leading grocer is up +1.13% to $31.604 billion, with net sales of retail items up a marginal +0.8% ($30.703b -> $30.960b). The company failed to translate the additional revenue into profit: Gross profit (-$1m), operating income (-16.1% to $1101m), operating margin (4.3% -> 3.6%) all declined. Though the financial services segment (boosted by the launch of new mobile shop kiosks / higher credit card transaction values) exceeded expectations (revenue +17.7%, operating income +31.1%, ebit +108.3%) Loblaw Companies still didn't improve its bottom line (total net earnings down -15.5% to $650m .. the lowest level in more than two years). EPS (basic) down to $2.31 (-15.4% vs 2011, -4.9% vs 2010).
Bright Spots - cash equivalents +3.07% -> $2.047 billion : not bad considering expenses the company faced in new product launches, store renovations, ecommerce, expansion of apparel department).
Total comprehensive income for the year is actually up +12.12% to $629 million. The difference is that, in 2011 there were other actuarial losses that amounted to $208m which is 10
The bad - Fourth quarter profit was down -17.82%; that despite both quarters being 12 weeks long. In the other three quarters (q3 q2 q1) profit was down -5.9%, -19.3%, -22.2%, respectively. Same-store sales growth: -0.2% (vs +0.9% the year before) which is disappointing considering Sobeys (+1.4%) and Metro (+1.2%) showed strong growth (investors should be asking this: why is competition affecting Loblaws more than Sobeys, Metro, Costco ?).X this year's amount.
Also of note: This is the second year with Vicente Trius at the helm (hired Feb 24, 2011).
Loblaws 3Q2012 (ended October 6, 2012) Loblaws profited C$222m in the third quarter of 2012, -5.9% lower vs 3q11, that despite overall revenue being +1.03% higher ($9.827b, $9.627b of which is from food/clothing (+0.7). 36% of the increase in quarterly revenue came from the financial services segment (higher PC and Mobile Telecom sales, credit card business also grew). qoq asset value up by 2.63% to $17.354b. For the 3Q 16 week period: Food/Apparel: Gross Profit increased by +1.6% to $2.104b, Net Earnings fell -6.8% to $222m, same store sales contracted -0.2% (vs 1.3% growth last year). Operating Margin now @3.7% (was 4.3% in 2011). Dividend per share now 22c up 1c qoq. 40 week nine month period: Retail Segment: Sales up +0.83% to $23.671b, Gross Profit down -0.1% to $5.244b, same store sales contracted by -0.2% (vs 0.4% growth last year). Financial Segment accounted for 26% of the change in revenue over the nine months ($26m/$262m). more on Loblaws here
Loblaws 2Q2012 (ended June 18, 2012) profited only C$159m in the second quarter  of 2012, -19.3% lower vs 2q11, that despite quarterly revenue being +1.33% higher ($7.375b which is actually the highest quarterly revenue in the last 4 quarters). 18.6% of the increase in revenue ($18m/$79m) actually came from the financial services segment (nice considering financial services only accounts for 1.8% of total revenue).
Ebitda (-7.5% --> $469m / -9.2% --> $878m for the half) and Net Earnings (-19.3% --> $159m / -20.6% --> $285m for
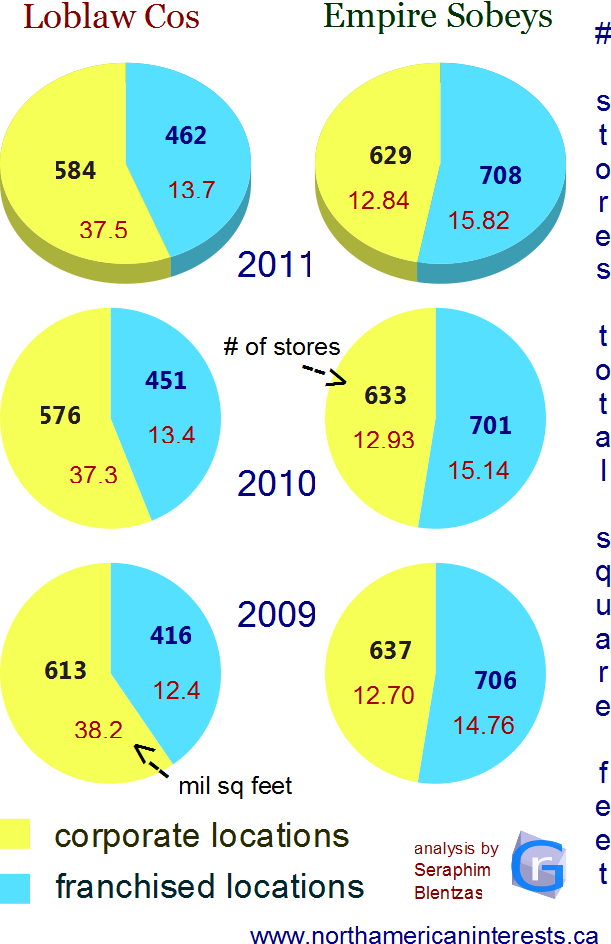
the half) were also down significantly. According to Loblaw Companies in its quarterly report, there are a couple reasons for the relatively poor results: 1. Higher labour costs 2. marginally higher food sales (though Loblaws did attribute part of that to food price inflation which according to the CPI index was 2.5% last quarter (down from 4.0% in 1Q2011) 3. $10m in customer appreciation costs / loyalty programs 4. flat sales of apparel, joe fresh style, drugstore items. Dividends per share steady at 21 cents (41c for the half) even though Earnings Per Share were down -18.6% (70c --> 57c / 128c --> 101c for the half). June 2012: Loblaw Companies store number is now at 1046 (585 corporate / 462 franchise) up from 1032 (578 corporate / 454 franchise) June 2011. Over the last 52 weeks loblaw companies added 0.4m ft2 to sales space --> 50.2m. same store sales growth +0.2%.
1Q2012: Loblaws profited $126 million in the quarter ended March 24, 2012 (1q12), a decrease of 22.2% over the previous year despite sales increasing by +0.9% to $6.937b; Keep in mind however that 1q12 revenue is down -5.9% from the previous quarter and is actually at its lowest level since 1q11 (when revenue was $6.872b); Also consider that 0.8% of the revenue is attributable to one less day of store operations.
98.1% of revenue orginated in retail where same-store sales fell -0.7%, gross profit fell -1.6% to $1.529b and operating income was 21.1% lower at $225m. Results were particularly disappointing when operating margin (3.3% down from 4.2%) and gross profit margin (22.5% vs 23.0%) are considered.
Good News regarding 1q12: Loblaws opened 25 new stores but closed only 5 resulting in a net addition of 0.6 million square feet of sales space = +1.2%.
Sales in clothing and other apparel was strong as was growth in revenue from gas stations (higher pump prices); Those factors compensated for flat sales in both food and drug products. There's been lots of negative pressure on Loblaws revenue stemming from flat food sales and lower sales in drugstore, apparel and general merchandise.
Sobeys parent Empire Company Limited has actually been controlled by the Sobeys clan since 1947 when Frank Sobey bought it for its land and ability to be transformed into an investment company (1947 was also the year Sobeys opened its first supermarket store in Pictou).
It was on the eve of Sobeys' 100th anniversary (celebrating JW's birthday, originally a marketer of meats) that Sobeys purchased Empire Company outright, acquiring the 27.9% of shares it didn't already own, for $1.06B or $58/share (April 26, 2007). That represents a $2-4 premium over the fair market value (Sobeys shares were delisted from the TSX on May 2, 2008).
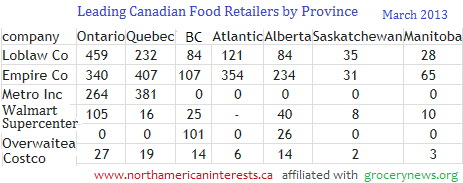
Quebec Sobeys has a significant presence in Quebec but not in the traditional sense; More than half of the locations are smaller supermarkets Marche Benichoix, Les Marche Tradition (118 combined). The only full service brand that it operates there that competes with Metro's 370 stores is IGA. Half of the over 200 IGA stores are IGA Extra located in suburban areas.
Brand Diversification and the Ethnic Market
Sobeys has also been more open to diversification
of its brands; After Metro acquired A&P it spent $200M to completely convert Loeb/A&P locations into Metro stores, however Sobeys chose a different route; After acquiring Price Choppers in the 1990's it left the brand largely intact for more than a decade before rebranding it as FreshCo, the other acquisition IGA/Oshawa Group ($1.5B deal in 1998 tripled its size and made it into a national company) was left intact. Initially, Sobeys did this in a bid to win over customers through customer appreciation efforts however brand diversification appears to have benefited Sobeys in the long run by allowing it to tap into different markets more effectively (Loblaws gained a bigger market share after it acquired T&T and launched No Frills in 1978 and now Sobeys is doing the same with FreshCo). FreshCo has proven popular among ethnic customers, a consumer base that already represents over 35% of shoppers in Ontario and will represent 31% of all Canadians by 2031. Only about 12% of the grocery market in the maritimes is in the discount market, that's in stark contrast to Ontario (45%) and Quebec (33%). In the discount market Loblaw's No Frills leads all other grocers, just the 152 No Frills stores in Ontario made $3.4B in sales last year more than Sobey's FreshCo and Metro's Food Basics combined. (June 2010: Grocery Trade Review)
Sobeys has experienced tremendous growth over the last decade even before its recent successes, between 2001 and 2006 Sobeys stock price rose by over 68%.
Sobeys also has a significant stake in Canadian real estate Crombie REIT: interest was 42.7% in August 2013, 42.8% in May 2013, 42.9% in Feb 2013, 43.0% in Nov 2012, 44.6% in Feb 2012, 45.9% late 2011, 46.5% Jan 2011. Owns 40.7% of Genstar Development Partnership. With Canadian real estate prices climbing (average home price up 6.5% in September/# of properties sold up 2.7% qoq) those investments are bound to pay off. Crombie Reit's properties include both high end assets (Barrington Place Shops, Cogswell Tower, CIBC Skyscraper in Halifax) and more traditional retail assets (Greenfield Park IGA plaza, Quebec). Sobeys also holds 100% ownership of Canada's second largest chain of movie theaters, Empire Theatres (Sobeys has operated cinemas since 1984). 2011 is also the year Sobeys converted most of its mainline locations into 24 hour supermarkets taking away from Superstore a key competitive advantage. About 85% of Empire's assets are associated with the food retailing business). Sobeys first reached $1 billion in sales in 1987, in 1999 (2000 fiscal year) Empire-Sobeys sales surpassed $10 billion for the first time, reflecting the first full year the Oshawa Group was part of it. Although revenue increased 75% that year, net income fell 35.7% to $86.7m.
Sobeys also has a significant stake in Canadian real estate Crombie REIT: interest was 42.7% in August 2013, 42.8% in May 2013, 42.9% in Feb 2013, 43.0% in Nov 2012, 44.6% in Feb 2012, 45.9% late 2011, 46.5% Jan 2011. Owns 40.7% of Genstar Development Partnership. With Canadian real estate prices climbing (average home price up 6.5% in September/# of properties sold up 2.7% qoq) those investments are bound to pay off. Crombie Reit's properties include both high end assets (Barrington Place Shops, Cogswell Tower, CIBC Skyscraper in Halifax) and more traditional retail assets (Greenfield Park IGA plaza, Quebec). Sobeys also holds 100% ownership of Canada's second largest chain of movie theaters, Empire Theatres (Sobeys has operated cinemas since 1984). 2011 is also the year Sobeys converted most of its mainline locations into 24 hour supermarkets taking away from Superstore a key competitive advantage. About 85% of Empire's assets are associated with the food retailing business). Sobeys first reached $1 billion in sales in 1987, in 1999 (2000 fiscal year) Empire-Sobeys sales surpassed $10 billion for the first time, reflecting the first full year the Oshawa Group was part of it. Although revenue increased 75% that year, net income fell 35.7% to $86.7m.


Food retailing makes up 98% of sales and 90% of operating income (2011 & 2010). The commercial real estate business contributes about 30% of funds from real estate operations even though it only contributes less than 15% of real estate revenue. Food Retailing: net debt/net total capital ratio was at its lowest level in 2011, hitting 13.4% it was as high as 32% just three years ago (2008). There are about 289 standalone Sobeys locations across Canada (23% of the company's locations). In fiscal 2011 57 freschco stores were opened, which exceeds units opened by main competitor No Frills.
Other Key Info
-> In 1999 it acquired the Oshawa Group, owner of IGA Canada ($1.5b increased sales by about 75% or $4b). In March 2002 Sobeys sold Serca Foodservice formerly part of Oshawa Foods to SYSCO for $411M. Since March 2006 Sobeys sold 105 properties to Crombie REIT raising 897M in 2 transactions. In 2011 Sobeys divested itself of Wajax stock by selling 27.5% of Wajax Income Fund for $121.3M (used the proceeds to pay down debt). The market value of all of its real estate investment holdings was 451.2M on May 7, 2011 comapred to $487.7M a year earlier (decrease was due completely to the divestment of its Wajax investment which was worth 117.9M in 2010).
-> Sobeys went private in 2007 when it became a subsidiary of Empire Company Limited following Empire's purchase of $1.06B worth of Sobeys outstanding common shares bringing its interest up to 100%. The company's 2011 revenue is 61% higher than it was in 2002 (145% increase in book value per share: 47.76).
-> In 2010 Sobeys lowered its debt to capital ratio from 32.7% down to 29.3% and consequently (in May) both Standard & Poor's and DBRS raised Sobeys credit rating. During fiscal 2010 food retailing/real estate represented 94% of net income. At the end of 2010 total locations (food retailing) under the various banners were 1,334 (28.1m square feet) in 836 communities. In 2011 free cash flow fell to $132.6M from 350.1M. In 2011 the company expanded 12 stores (down from 13 in 2010/11 in 2009), opened 44 (up from 41 in 2010/47 in 2009) and closed 39 locations (down from 52 in 2010).
Since 2001, fiscal year dividends have more than quadrupled from 20c to over 80c a share.